Abstract
Controlling the composition of sodium- and lithium-ion batteries is important to ensure that solvents, additives and
charge-carrying ions match the required formulation for effective battery performance. This Application Note
demonstrates how quantitative nuclear magnetic resonance spectroscopy (qNMR) using the Oxford Instruments X-Pulse
benchtop NMR spectrometer can measure different electrolyte components. Examples include relative quantification of
solvent composition using 1H and 13C qNMR, absolute quantification of lithium concentration
using 7Li NMR with external calibration, and quantification of [PF6]- and
[BF4]- anions using 19F qNMR with an internal standard. The results demonstrate how
both relative and absolute qNMR methods can support battery electrolyte formulation development, quality assurance,
and quality control.
Introduction
Lithium-ion (Li-ion) batteries have become ubiquitous in daily life, providing power for a diverse range of
applications, ranging from mobile phones, computers, power tools, and medical devices to the green technologies
including electric cars and solar energy storage. As our usage of lithium-ion batteries has grown, so has the need to
optimise their performance and to ensure reliability over a long lifetime. At the same time new technologies including
sodium-ion (Na-ion) batteries are in development.
Electrolytes play a crucial role in the performance and reliability of Li-ion batteries, providing the medium that
allows anions and cations to carry charge between the electrodes, as shown in Figure 2.1. In the current
generation of commercial batteries, the electrolyte is typically made up of organic small-molecule liquid solvents,
commonly a mixture of alkyl carbonates, combined with a lithium salt. Additionally, various additives are used to
ensure specific chemical and electrochemical properties.
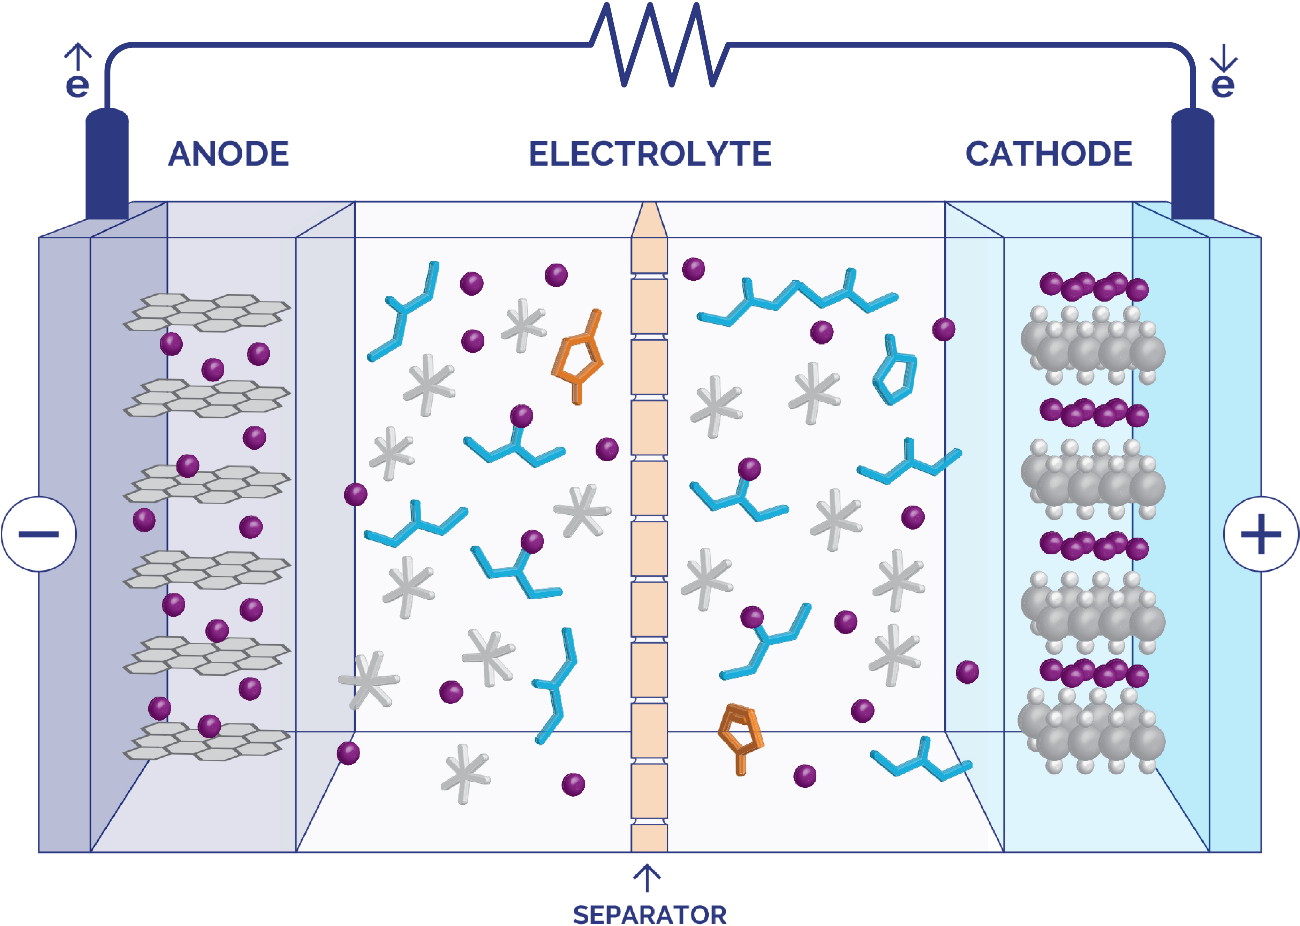
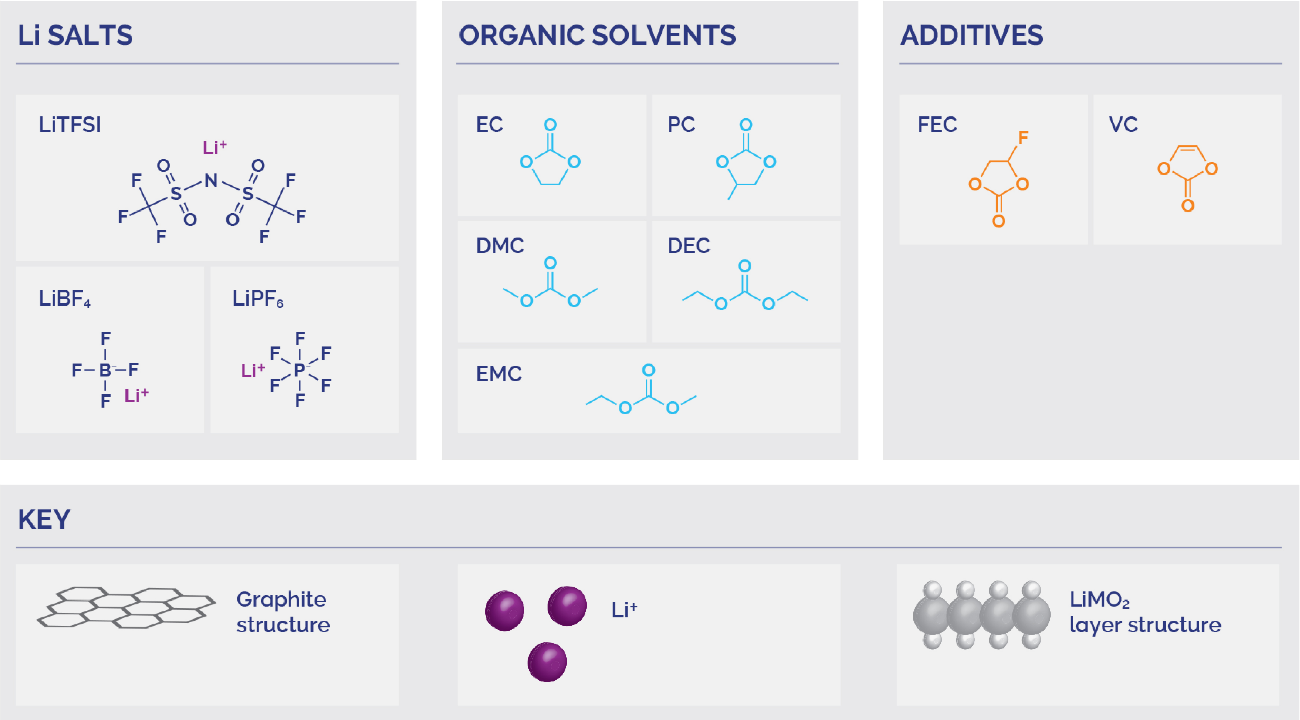
Figure 2.1 Diagram of a lithium-ion battery, showing major components including the
anode, cathode, separator, and electrolyte.
While lithium-ion batteries have played a major role in transforming our daily lives, benchtop NMR spectroscopy has
similarly begun to revolutionise quality assurance and quality control (QA/QC) processes by making a powerful
technique easier and more accessible for routine analysis in any laboratory. Benchtop NMR has many potential
lithium-ion battery QA/QC applications, as the well-resolved spectra of the small organic molecules and ions are
ideally suited for quick, convenient analysis.
The Oxford Instruments X-Pulse broadband benchtop NMR spectrometer (available with a 60
MHz or 90 MHz permanent magnet) provides significant advantages for analysis of battery electrolytes. In this
Application Note we look at how benchtop NMR can be used for quantitative analysis of Li-ion battery electrolytes.
Since the exact composition of the electrolyte will affect the performance of the battery, ensuring the electrolyte
matches its specification is essential for quality control in the manufacture of Li-ion batteries.
Quantitative NMR as an Analytical Method
When performed correctly, NMR is an inherently quantitative method, in which case it’s usually referred to as qNMR.
It therefore allows for not only the qualitative composition of a sample to be determined, but also to accurately
quantify the species present.
When performing quantitative NMR (qNMR), there are three important considerations:
- ensuring the NMR spectrum acquired is actually quantitative
- if you’re performing relative or absolute quantification
- if you’re performing absolute quantification, if you’re using an internal or external standard
These are summarised in the following sections.
It’s important to recognise that the accuracy of qNMR, like that of any other quantitative measurements, can be
affected by every stage of the measurement process, from sample preparation through to data processing. Important
sources of error include incomplete dissolution or extraction, losses during transfer, contamination, uncertainty in
weighing or volumetric preparation, and the purity and stability of calibration standards. Additionally errors may
arise from the measurement itself, although these are usually minimal for NMR.
Throughout this application note, these sources of error haven’t always been accounted for. Therefore errors in
the measurement in practice are usually going to be greater than those indicated, if present.
Requirements for Accurate Quantitative NMR
To ensure that an NMR spectrum is quantitative, every signal used for analysis must be acquired under conditions
where its integral is proportional to the number of nuclei contributing to that resonance.
The most important requirement is sufficient relaxation between scans: The relaxation delay should normally be at
least five times the longest spin-lattice relaxation time (T1), so that all resonances have
effectively returned to equilibrium before the next pulse. Pulse angles should be calibrated, receiver gain kept
within the linear range, and enough scans acquired to provide adequate signal-to-noise without compromising the
relaxation delay. The selected signals should be well resolved and free from overlap or treated consistently by peak
fitting where overlap is unavoidable, and the final spectrum should be carefully phased, baseline corrected and
integrated over reproducible limits.
When these acquisition and processing conditions are controlled, the measured integrals can be used with confidence
for relative or absolute quantification. All the spectra in the Application Note have been acquired on the
X-Pulse 90 and processed in accordance with these guidelines.
Relative vs Absolute Quantitative NMR
In quantitative NMR (qNMR), signal integrals are directly related to the number of resonant nuclei, allowing NMR
spectra to be used not only for identification but also for measuring composition.
Relative quantification compares the integrals of signals within the same spectrum to determine the ratios of
components in a mixture, making it well suited to applications such as solvent composition, impurity profiling and
additive screening where absolute concentration is not required.
Absolute quantification extends this approach by comparing analyte signals against a material of known amount or
concentration, either added to the sample as an internal standard or measured separately using an external
calibration.
In both cases, reliable results depend on appropriate signal selection, sufficient relaxation delay, good
signal-to-noise and careful integration so that the measured peak areas accurately reflect the true number of nuclei
present.
Internal vs External Standards
For absolute quantification by NMR, the analyte signal must be compared with a standard of known amount or
concentration. This can be achieved using either an internal or an external standard.
In the internal-standard approach, an accurately measured reference compound is added directly to the same NMR sample
as the analyte, so the analyte and standard experience the same acquisition conditions and the concentration
calculation is based on their integral ratio. This often gives high precision, provided that the standard is pure,
soluble, chemically inert and gives a well-resolved signal that does not overlap with the analyte.
In the external standard approach, the reference material is prepared and measured separately, placing greater
emphasis on accurate preparation, stable instrument response and consistent acquisition conditions.
The choice between the two approached therefore depends on the analytical priority: internal standards are generally
preferred when precision and simplicity of calculation are most important, whereas external standards are useful when
the sample must remain unchanged or when addition of a standard is impractical.
Examples of Quantitative NMR Analysis of Battery Electrolytes
Using a series of Li-ion battery electrolyte related samples, various methods for quantitative NMR can be
demonstrated.
Measuring Battery Electrolyte Solvent Composition by qNMR
The solvents for Li-ion battery electrolytes generally comprise a mixture of alkyl carbonates in various proportions.
Quantitative NMR is an ideal method for accurately measuring their amounts. An initial sample was prepared containing
approximately a 1:1:1:1 ratio (by volume) of dimethyl carbonate (DMC), diethyl carbonate (DEC), ethylene
carbonate (EC) and vinylidene carbonate (VC) (Sample I). A 1H NMR spectrum with 13C
decoupling was acquired with quantitative parameters (Figure 2.2) with an acquisition time of 4 minutes.
To determine the ratio of these signals, and hence the ratio of the different compounds, the area of each signal must
be determined. The traditional approach is to integrate each signal within the spectrum. Another approach is the fit
the signals to individual peaks and determine the signal area by summing the areas of the appropriate peaks. Both
approaches have been used in this case.
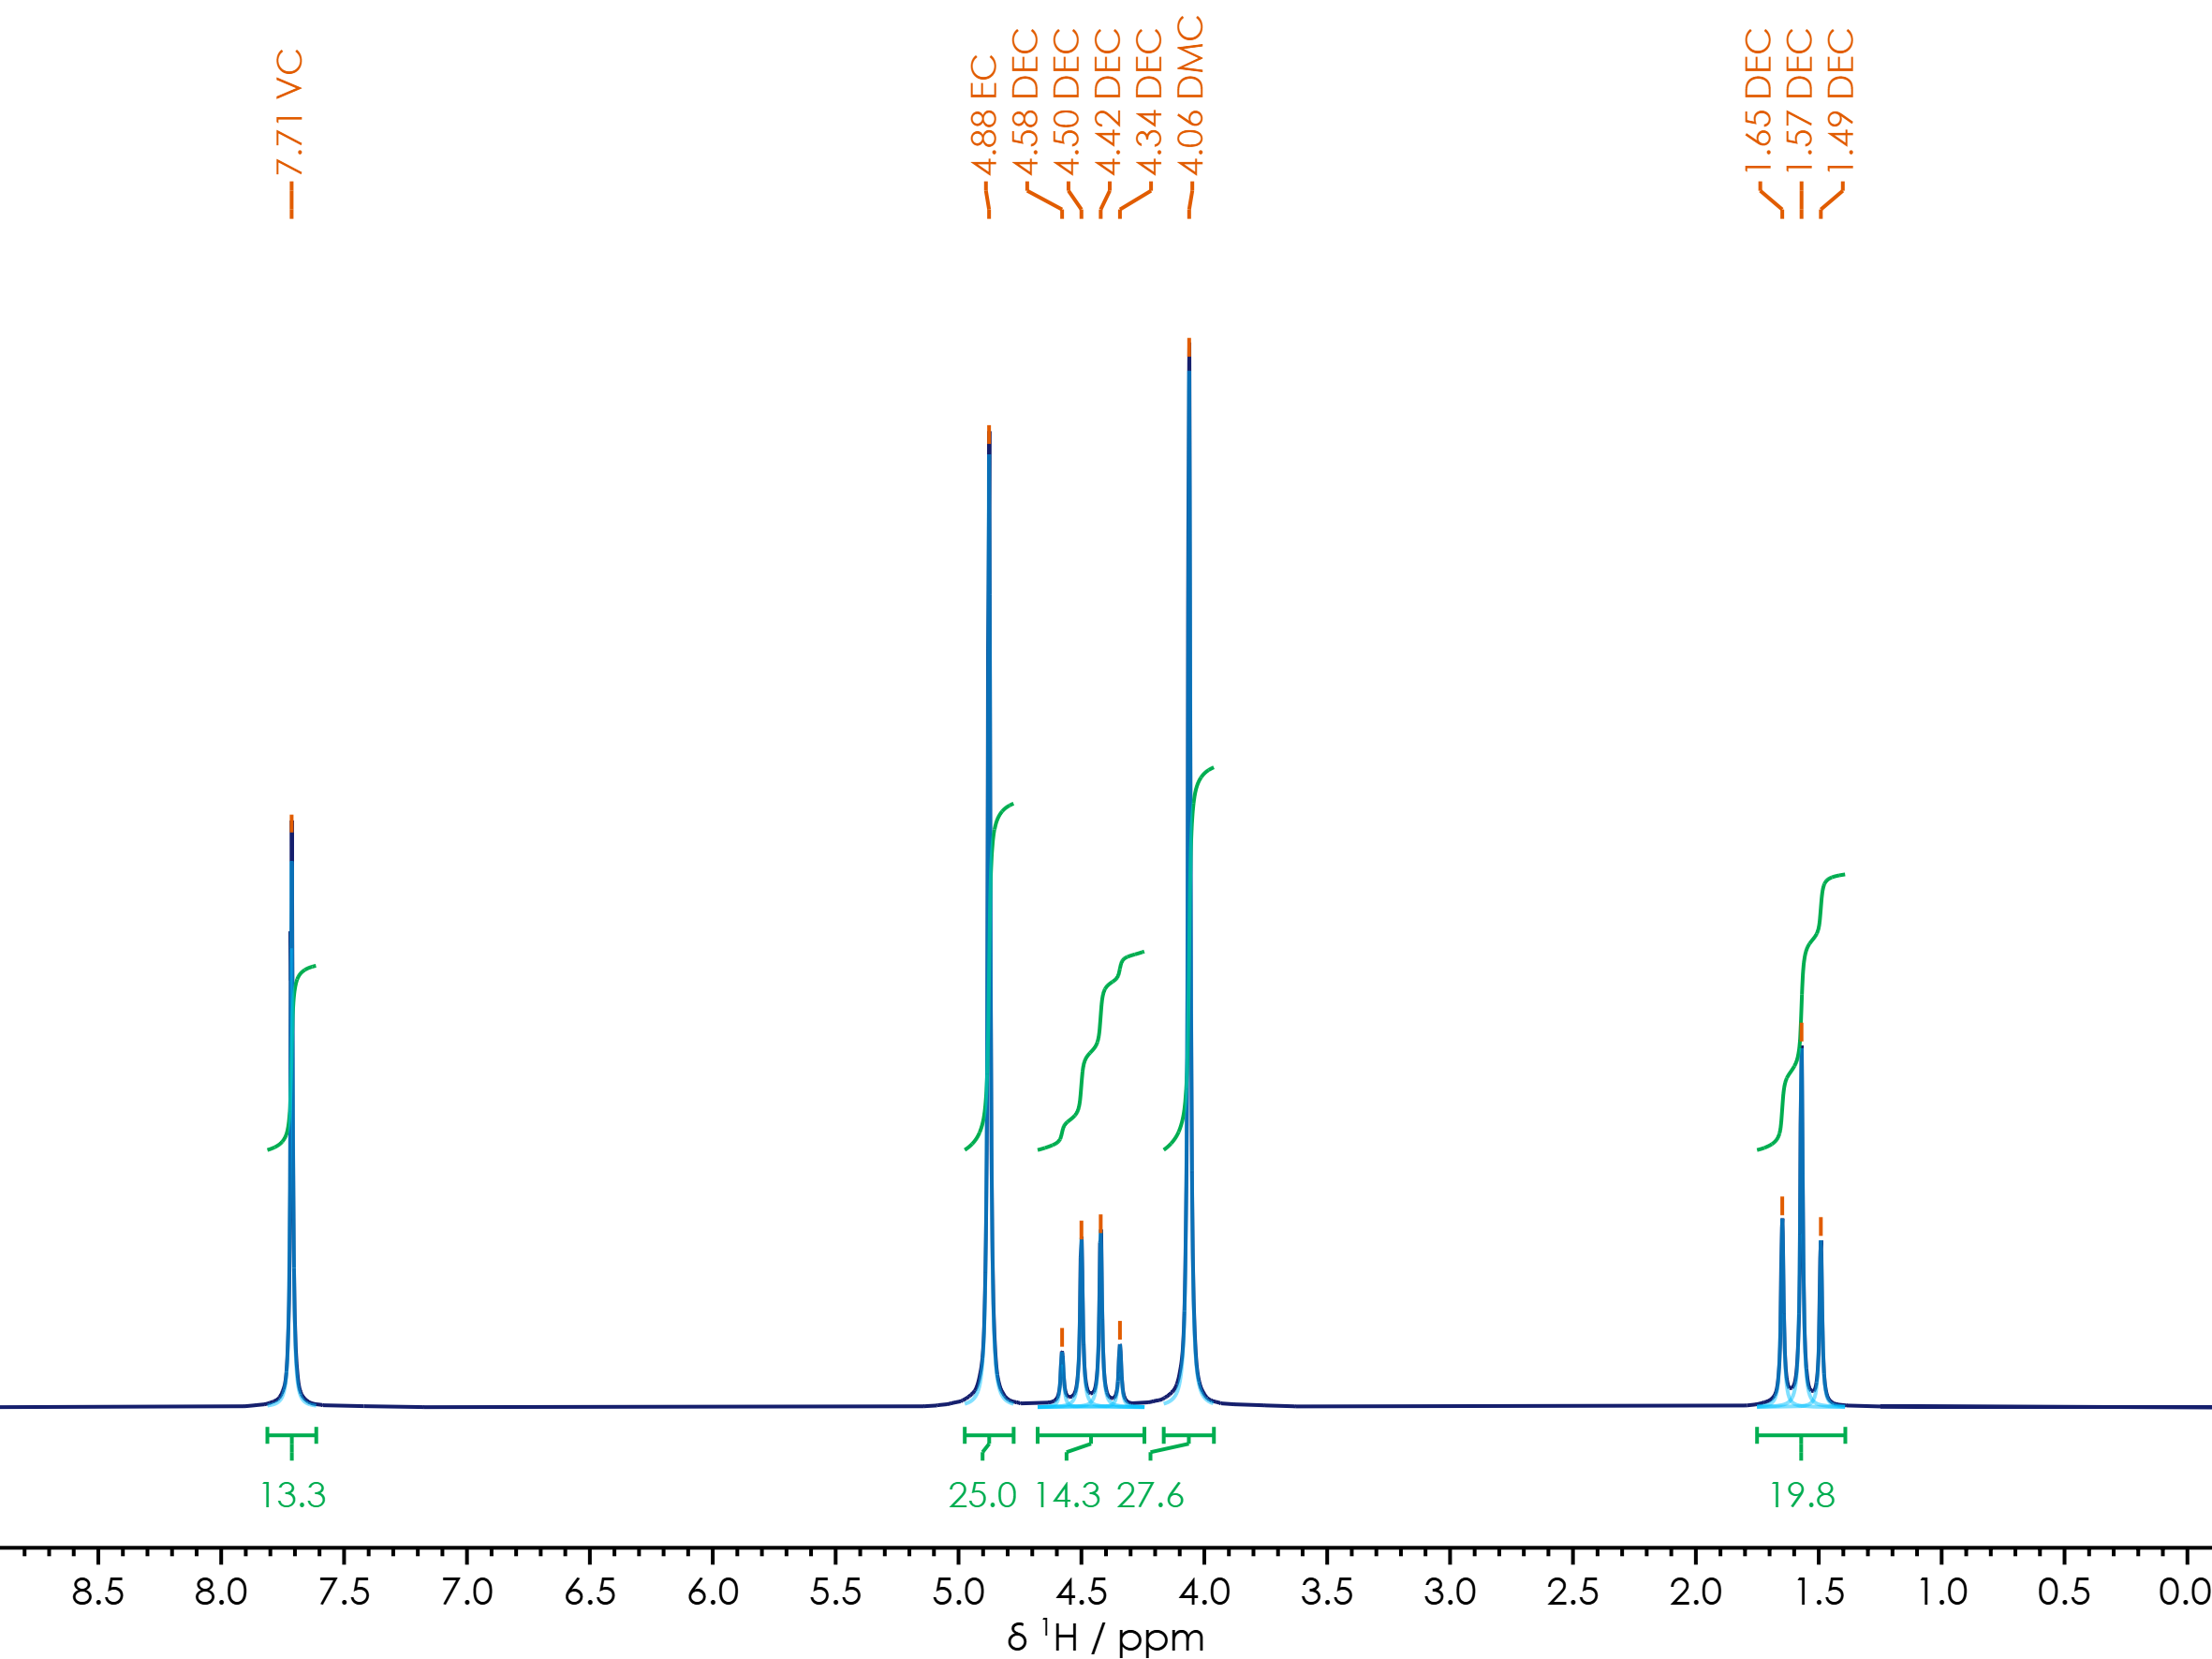
Figure 2.2 1H{13C} qNMR, spectrum of
Li-ion battery electrolyte, comprising a mixture of DMC/DEC/EC/VC (spectrum in dark blue, fitted peaks in light
blue)
The ratio of alkyl carbonates can also be determined with quantitative 13C NMR. However, due to the lower
receptivity of 13C compared to 1H, coupled with longer T1 relaxation times,
acquiring the spectrum takes considerably longer, with a quantitative 13C{1H} spectrum of the
same sample (Figure 2.3) acquired in 21 hours 20 minutes.
Even in this case the signal-to-noise ratio (SNR) is low enough that integrating individual peaks would have an
unacceptably high error. However, by fitting the peaks, specifically those of the carbonate carbons, the area of each
signal and hence amount of each compound, can still be determined.
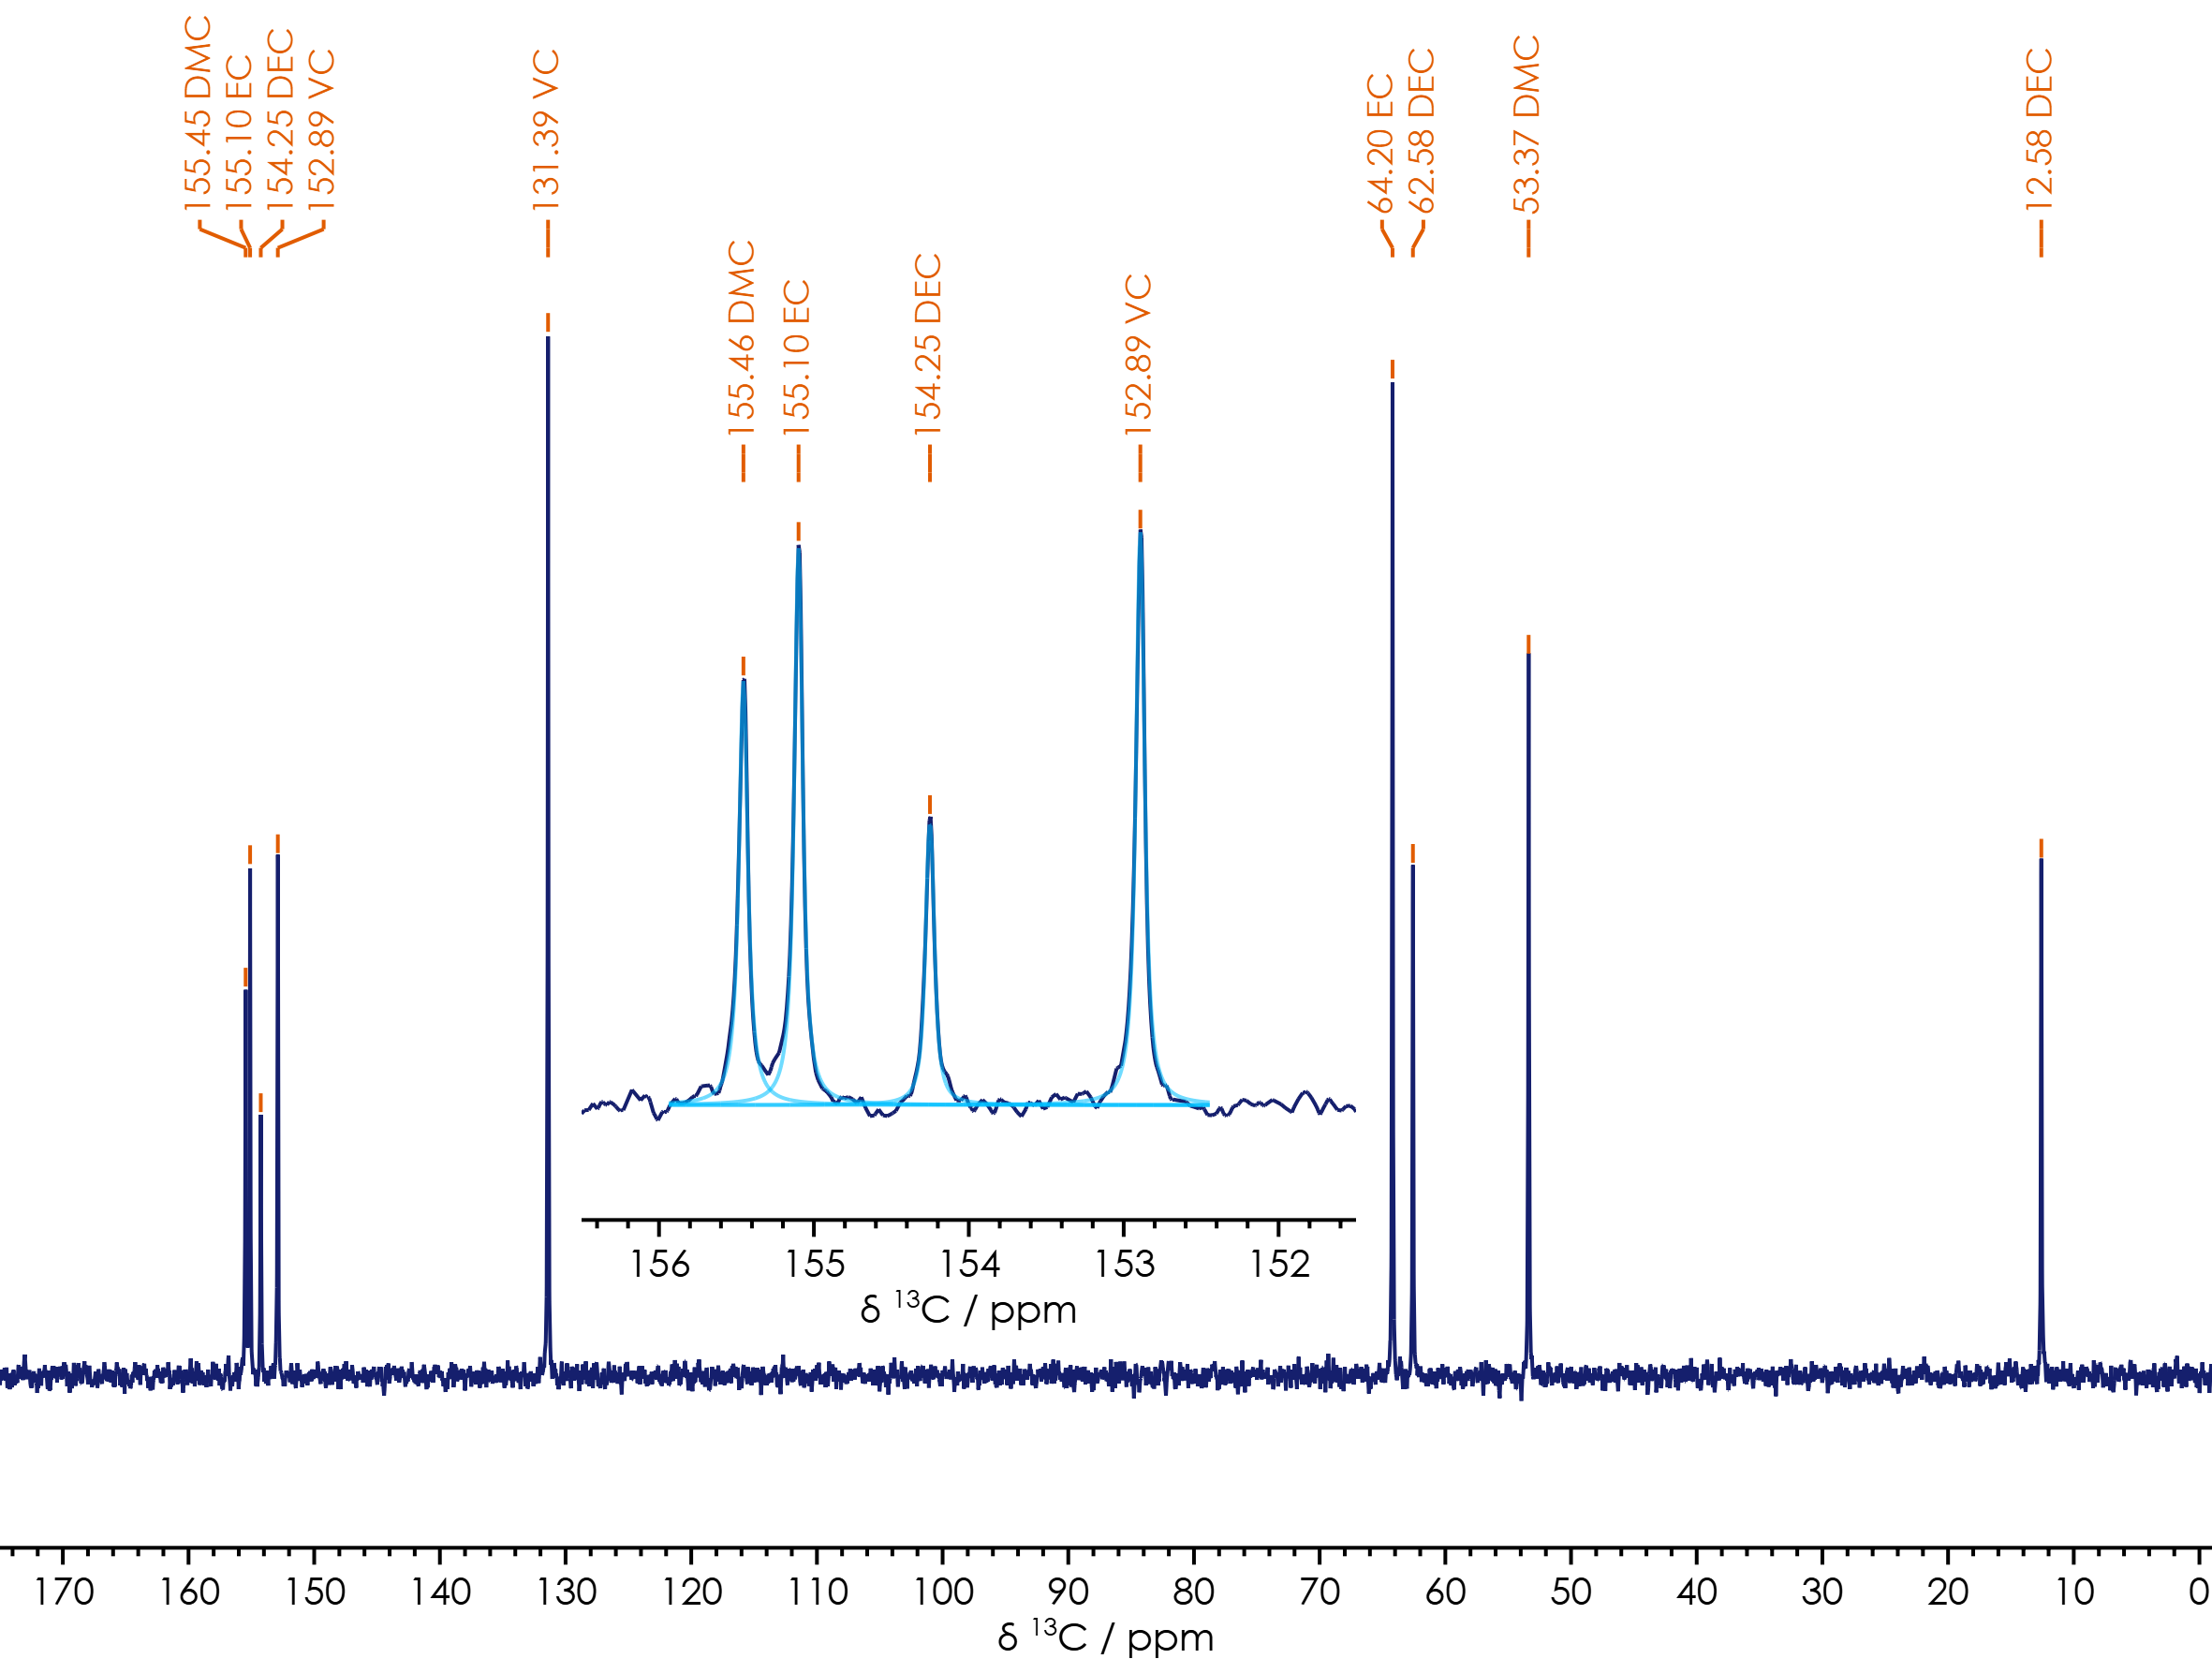
Figure 2.3 13C{1H} qNMR, spectrum of
Li-ion battery electrolyte, comprising a mixture of DMC/DEC/EC/VC; insert showing carbonate region (spectrum in dark
blue, fitted peaks in light blue)
By converting the volume ratio used to prepare Sample I into a normalised molar ratio, which is also
the expected signal ratio of the 13C carbonate signals, we can predict signal ratios of the signals in the
1H{13C} NMR spectrum (Table 2.1) and compare these with the compositions obtained from
the NMR spectra. In this case, both the 1H and 13C NMR spectra can be used to obtain the actual
sample composition.
For the 1H spectra, measuring the signal areas with peak fitting appears to give more consistent values
than obtained by signal integration since it minimises the effect of the signal overlap.
Table 2.1 EC/DMC/DEC/VC molar & signal ratios comparing predicted values derived
from the volume ratio and the measured values from the
1H{13C} &
13C{1H} qNMR spectra
| Sample I | ≥99% Ethylene Carbonate (EC) | ≥99% Dimethyl Carbonate (DMC) | ≥99% Diethyl Carbonate (DEC) | ≥97% Vinylene Carbonate (VC) |
| Volume Ratio | 1.00±0.01 | 1.00±0.01 | 1.00±0.01 | 1.00±0.01 |
| Molar Mass (g/mol) | 88.06 | 90.08 | 118.13 | 86.05 |
| Density (g/mℓ) | 1.321 | 1.069 | 0.975 | 1.355 |
| Molar Density (mmol/mℓ) | 15.00 | 11.87 | 8.25 | 15.75 |
| Molar Ratio (normalised) | 29.8±0.29 | 23.3±0.24 | 16.2±0.16 | 31.1±0.31 |
| Measured 13C Carbonate Signal Ratio | 29.8 | 24.2 | 14.9 | 31.1 |
| Number of Hydrogens | 4 (2× CH2) | 6 (2× CH3) | 4 (2× CH2) | 6 (2× CH3) | 2 (2× CH) |
| NMR Signal Ratio (normalised) | 24.5±0.24 | 29.0±0.29 | 13.5±0.13 | 20.2±0.22 | 12.8±0.13 |
| Measured 1H NMR Signal Ratio | by integration | 25.0 | 27.6 | 14.3 | 19.8 | 13.3 |
| by peak fitting | 25.2 | 27.8 | 13.7 | 20.0 | 13.2 |
A more realistic sample composition is a 1:1:1 mixture of EC/DMC/DEC, with a small amount of VC added. Four more
samples were prepared Sample II, III, IV, & V,
containing gradually increasing amounts of VC. This can clearly be shown in Figure 2.4, with the VC peak at
δH 7.7 ppm.
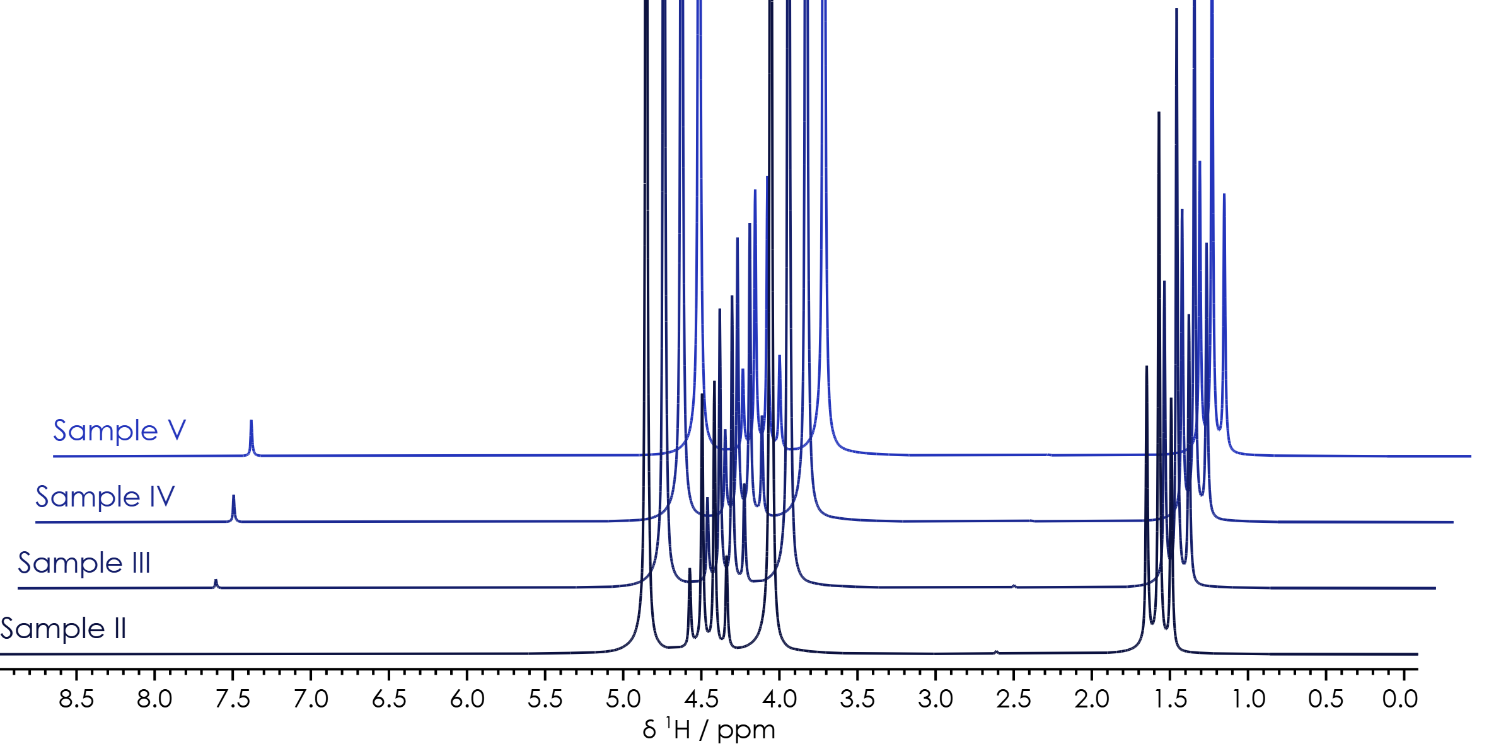
Figure 2.4 13C{1H} qNMR, spectrum of
Li-ion battery electrolyte, comprising a mixture of DMC/DEC/EC, with varying amounts of VC
By analysing Sample II, the EC/DMC:DEC molar ratio can be accurately measured and confirmed to match
the predicted value of the basis of the 1:1:1 volume ratio used to prepare the sample (Table 2.2).
Table 2.2 EC/DMC/DEC molar & signal ratios comparing predicted values
derived from the volume ratio and the measured values from the
1H{13C} qNMR spectra
| Sample II | Ethylene Carbonate (EC) | Dimethyl Carbonate (DMC) | Diethyl Carbonate (DEC) |
| Volume Ratio | 1.00±0.01 | 1.00±0.01 | 1.00±0.01 |
| Molar Mass (g/mol) | 88.06 | 90.08 | 118.13 |
| Density (g/mℓ) | 1.321 | 1.069 | 0.975 |
| Molar Density (mmol/mℓ) | 15.00 | 11.87 | 8.25 |
| Molar Ratio | 15.00±0.15 | 11.87±0.12 | 8.25±0.08 |
| Number of Hydrogens | 4 (2× CH2) | 6 (2× CH3) | 4 (2× CH2) | 6 (2× CH3) |
| Predicted NMR Signal Ratio (normalised) | 28.1±0.28 | 33.3±0.33 | 15.4±0.15 | 23.2±0.23 |
| Measured NMR Signal Ratio | 29.4 (peak fitting) | 32.2 (peak fitting) | 15.5 (peak fitting) | 22.8 (peak fitting) |
Using the process already shown, the 1H{13C} spectra of samples III,
IV & V can be analysed and the actual percentage vinylidene carbonate
present in the sample can be determined (Table 2.3). While the actual amount of VC in Sample
III was consistent with the target amount, the amount of VC in both samples IV &
V was significantly higher that the target value, suggesting an error is sample preparation.
This degree of variation in sample composition is sufficient to affect the performance of a Li-ion battery,
demonstrating both the importance of quality control of the alkyl carbonate solvent and the value of benchtop NMR for
this analysis.
Table 2.3 VC content in an EC:DMC:DEC solution, as determined by
1H{13C} qNMR
| Sample II | Sample III | Sample IV | Sample V |
| 1:1:1 EC:DMC:DEC (mℓ) | 0.60±0.01 | 0.60±0.01 | 0.60±0.01 | 0.60±0.01 |
| VC (µℓ) | 0.0 | 2.0±0.1 | 4.0±0.1 | 6.0±0.1 |
| Nominal %VC (by volume) | 0.00 | 0.33±0.02 | 0.66±0.03 | 0.99±0.04 |
| Measured %VC | (by molarity) | 0.00 | 0.43 | 1.24 | 1.84 |
| (by volume) | 0.00 | 0.32 | 0.93 | 1.39 |
Quantifying Lithium Content using External Standards
A 7Li NMR spectrum of Li+ comprises a single peak at around δLi 0 ppm. To accurately
quantify the total amount of lithium present in the sample, it’s necessary to use an external calibration.
A series of samples containing accurately measured amounts of Li+ were prepared at a range of
concentrations ranging from 200 mmol/ℓ to 1.00 mol/ℓ, with identical 7Li NMR spectra acquired for each.
Previously the T1 relaxation time for Li+ has been determined as 22.1 s, therefore
spectra were acquired with a relaxation time of 2 minutes using 16 scans.
Examples of the resulting spectra are shown in Figure 2.5, clearly showing the linear relationship between
lithium concentration and the intensity of the NMR signal.
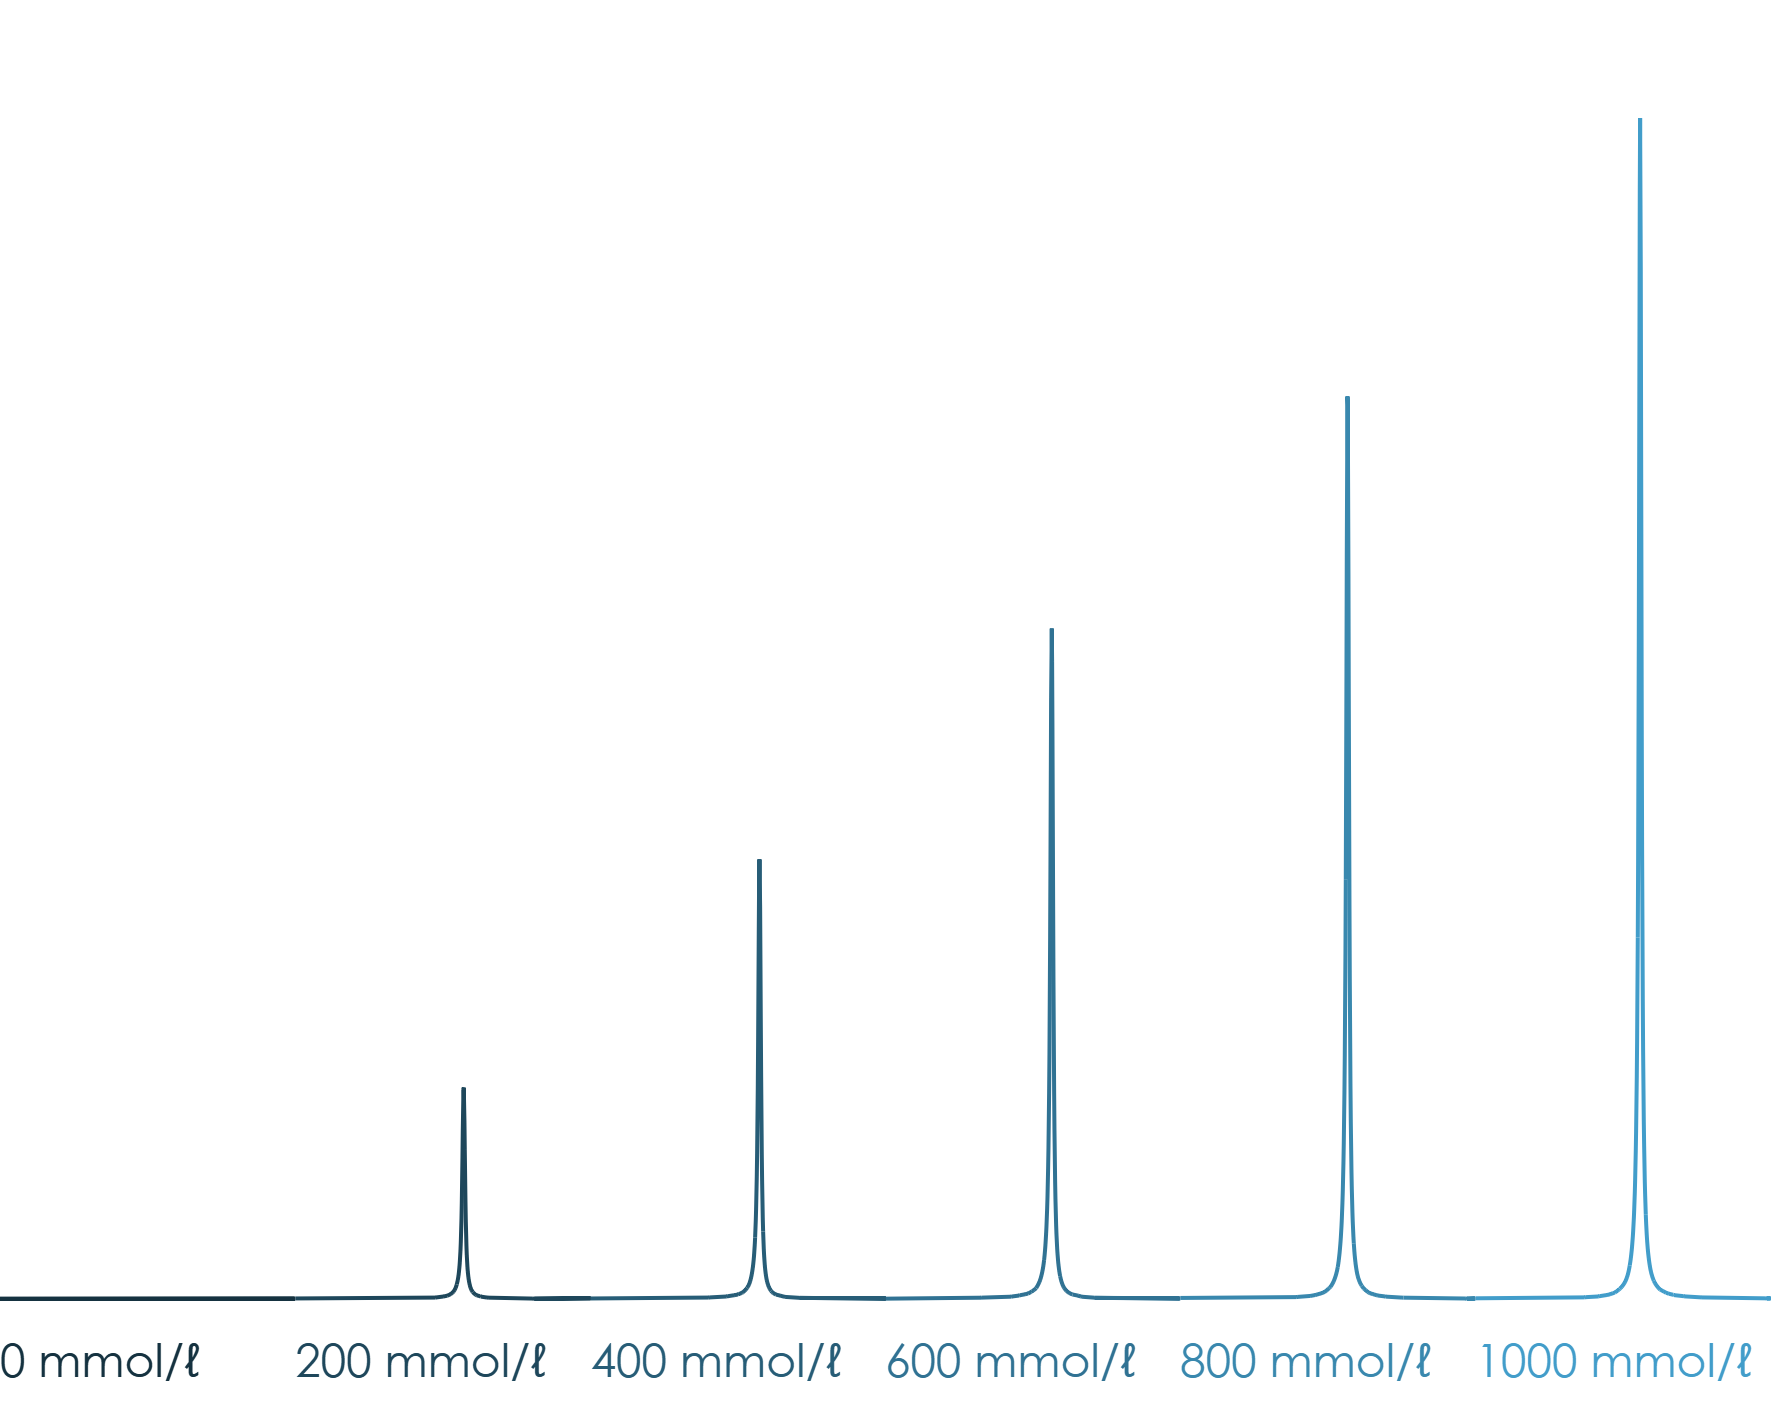
Figure 2.5 7Li qNMR spectra for varying
Li+ concentrations
These measurements were repeated three times, with a standard deviation between the repetitions of less than 0.2 %.
By plotting the lithium concentration against the signal areas, an equation can be determined for the resulting linear
correlation (Figure 2.6).
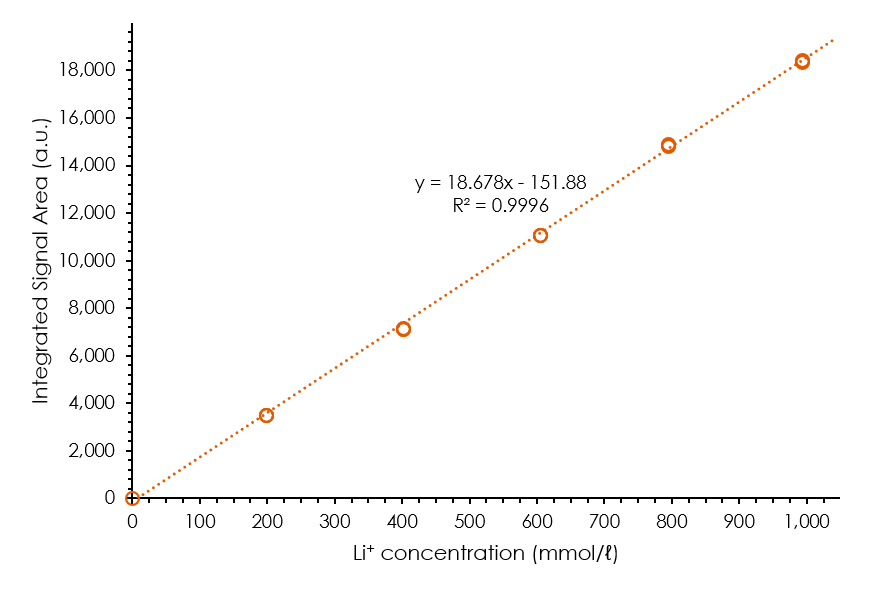
Figure 2.6 Calibration of Li+ concentration with
Integrated Signal Areas by 7Li qNMR
Using this calibration ‘curve’ and equation, we can then analyse samples with an unknown Li+
concentration, and determine the concentration from the signal.
Table 2.4 Lithium concentration in unknown samples, determined by
7Li qNMR
|
Integrated Signal Area |
c (Li+) / mmol/ℓ |
| Unknown Sample One |
7930 (40) |
416 |
| Unknown Sample Two |
16161 (57) |
857 |
Quantifying Electrolyte Anions using an Internal Standard
The third method for performing qNMR, is through absolute quantification using an internal standard. In this
case, an accurately measured amount of 99.9% pure α,α,α-trifluorotoluene was added to a
battery electrolyte containing a mixture of [PF6]− and [BF4]− salts.
Initially, 19F inversion recovery experiments were performed to determine the T1
relaxation times of the three species (Table 2.5).
Table 2.5 T1 relaxation times, measured by a
19F inversion recovery experiment
|
T1 / s |
| C6H5CF3 |
2.0 |
| [PF6]− |
2.8 |
| [BF4]− |
3.5 |
To perform accurate quantitative measurements, the relaxation delay should be at least 5 times the longest
T1. Therefore, setting a relaxation delay of 20 seconds, along with acquiring 16 scans, allows for
the acquisition of a 19F{13C} qNMR spectrum in under 5 minutes (Figure 2.7).
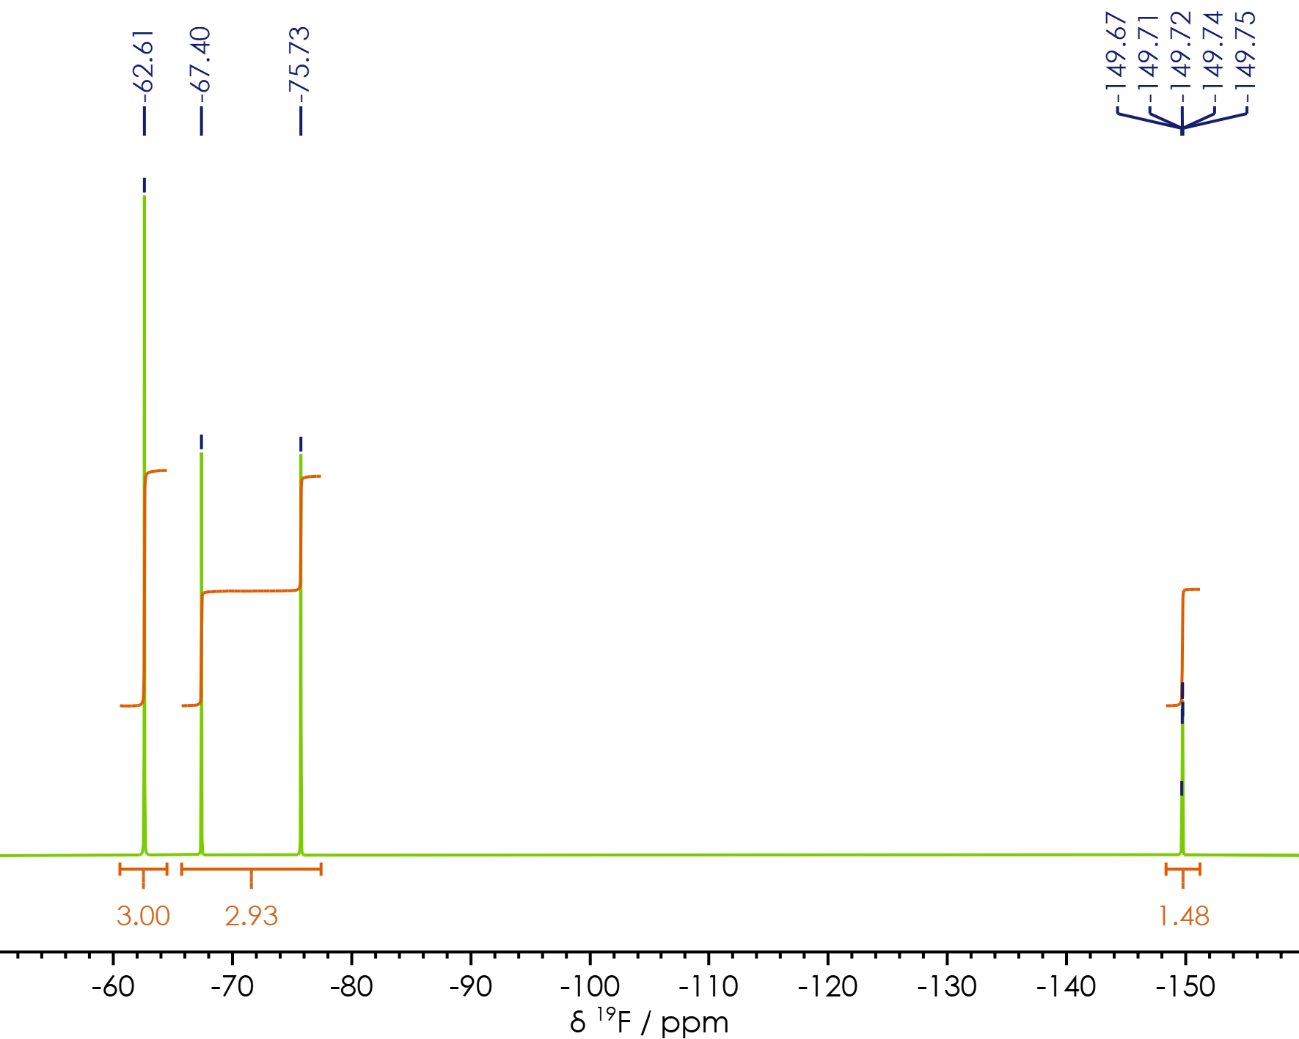
Figure 2.7 19F{13C} qNMR
spectrum of a mixture of [PF6]− &
[BF4]− plus α,α,α-trifluorotoluene as an internal standard
Table 2.6 Determination of anion concentrations using
19F{13C} qNMR and a
C6H5CF3 internal standard of
known concentration
|
Absolute Integrated Area |
Absolute Integral per Molecule |
c / mmol/ℓ |
| C6H5CF3 |
32754 |
10918 |
1701 |
| [PF6]− |
31948 |
5325 |
830 |
| [BF4]− |
16201 |
4050 |
631 |
The accuracy of this calculation could be further improved by considering the accuracy of the concentration
calculated for C6H5CF3 with the accuracy in the measured volumes / masses propagated
through to the concentration, taking in account the purity of C6H5CF3 and the affect
that has on its concentration, and considering the reproducibility of the NMR measurement, for which the standard
deviation is expected to be of less than 0.2 %. Together, these considerations would allow for the concentration and
associated standard error to be determined.
Summary
The
X-Pulse 90 and X-Pulse
60 broadband benchtop NMR spectrometers are ideal tools for the quantitative analysis of lithium-ion
battery electrolytes. When performed correctly, NMR in an inherently quantitative technique, which can be used for
either relative or absolute quantification, using either internal or external standards. This allows for the most
appropriate quantification method to be chosen depending on the chemistry of the sample. All these methods are
applicable to the different components of a Li-ion or Na-ion battery electrolyte.

