Introduction
Phase discrimination using Electron Backscatter Diffraction (EBSD) is a powerful tool for the positive identification of phases that exist in materials at the microscopic level. Accurate phase identification is a basic requirement of an EBSD system. This technical note illustrates the capability of Oxford Instruments' AZtecSynergy microanalysis system using the Tru-I indexing engine to perform Phase Identification. This is coupled with simultaneous EBSD and X-ray chemical mapping. A high temperature steel containing second phase particles is used as an example material; this sample contains phases which are traditionally very difficult to differentiate using EBSD.
Experimental
The sample was in the form of a 10mm thick plate. Specimens were extracted from the plate and mounted in conductive bakelite. They were polished mechanically using standard procedures down to colloidal silica. The final stage involved vibratory polishing for an hour.
The polished samples were examined in a FEG/SEM operating at acceleration voltage and probe current of 20 kV and 760 pA respectively. The HKL NordlysNano EBSD detector and the X-Max® 80 large area silicon drift X-ray detector coupled with the AZtec® suite of microanalysis software was used for this analysis.
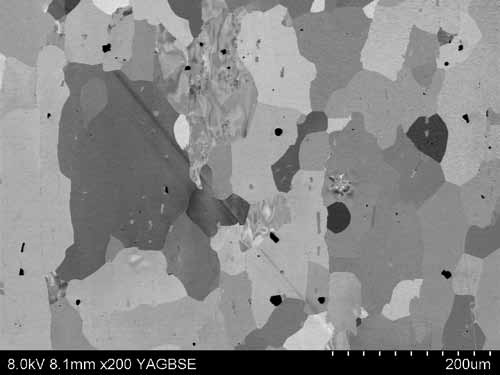
Figure 1a: Low magnification back-scattered electron image showing orientation contrast in the matrix grains, dark angular and elongated grey particles.
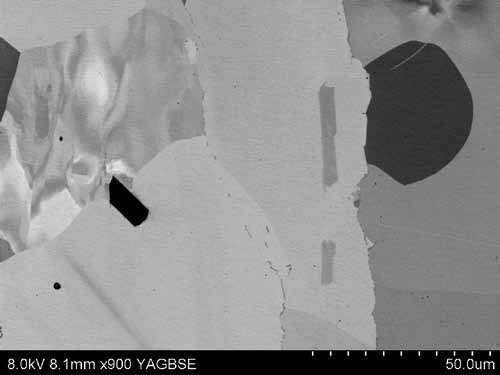
Figure 1b: Higher magnification image of the area highlighted in Figure 1a. The coarse dark and grey contrasting particles can be seen, as well as very fine grain boundary particles.
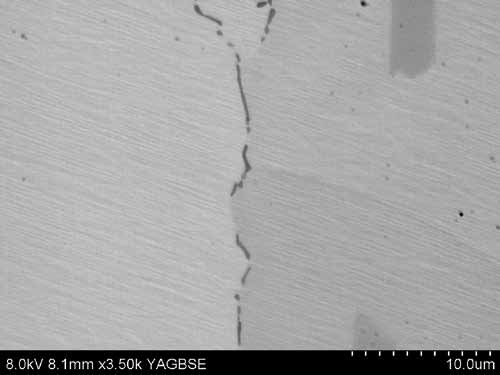
Figure 1c: A high magnification back-scattered image showing the fine grain boundary particles.
Results and Discussion
Back-scattered electron micrographs from the steel are shown in Figure 1. These images reveal a partially recrystallised structure with very coarse, dark contrasting particles, intermediate sized grey intra-granular particles and fine grain boundary particles.
Good quality EBSD patterns were possible from all the different phases in this sample and typical patterns from the matrix, grey and dark contrasting particles are shown in Figures 2a, b and c, together with the corresponding spectra collected simultaneously using Energy Dispersive Spectrometry (EDS).
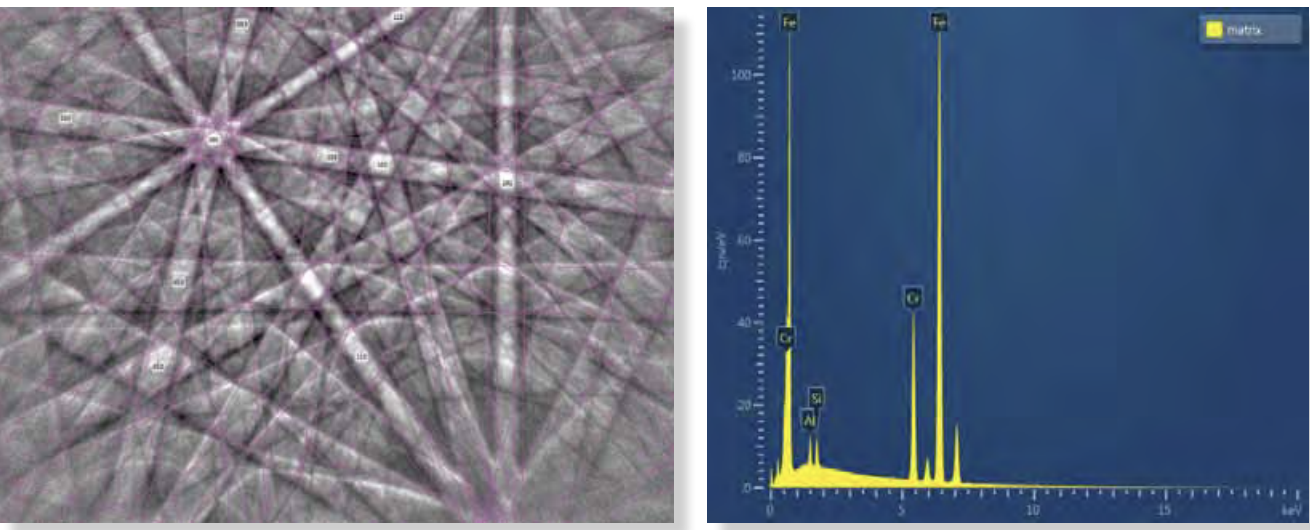
Figure 2a: EBSD pattern and X-ray spectrum from the matrix.
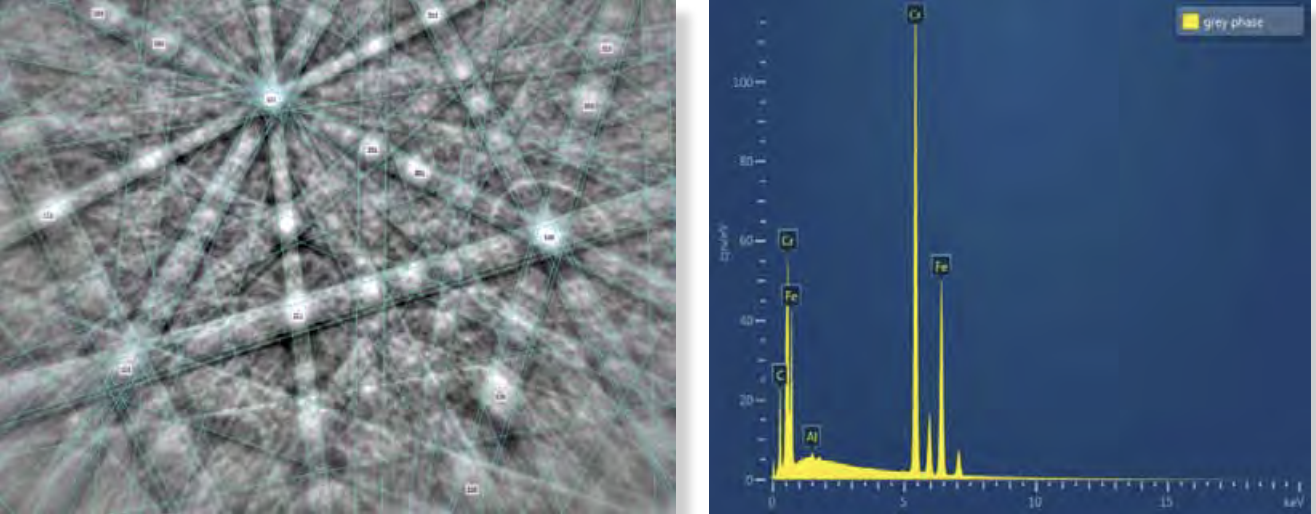
Figure 2b: EBSD pattern and spectrum from the grey angular particles.
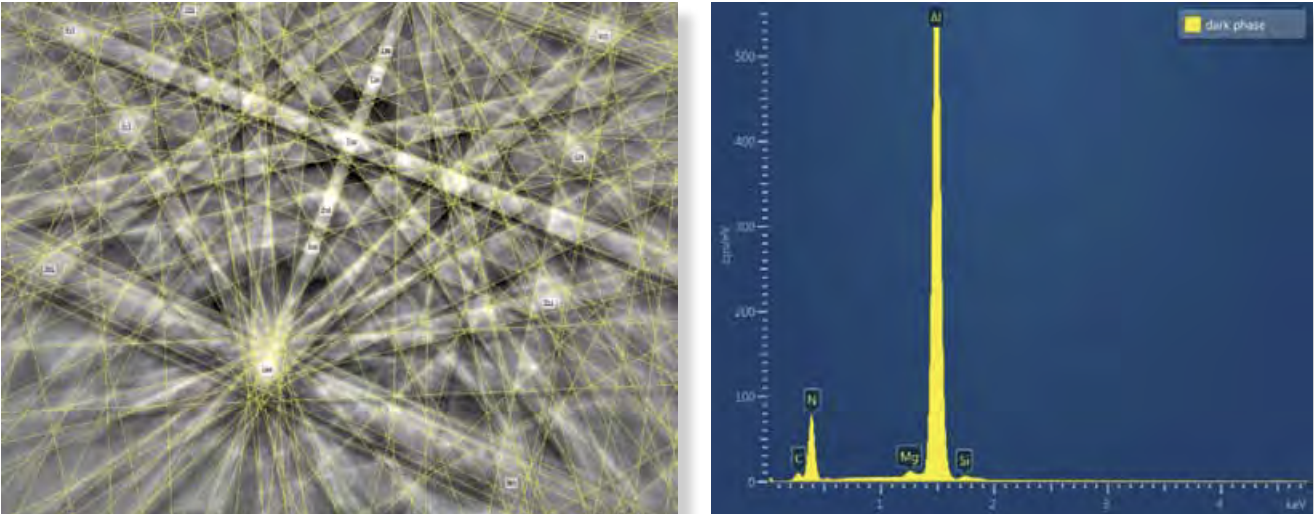
Figure 2c: EBSD pattern and spectrum from the coarse dark particles.
The quantitative chemical analysis and the phases identified using the combined EDS and EBSD data for each of the phases in the steel are listed in Table 1. In addition, the fine grain boundary particles were found to index satisfactorily with the Cr15.8Fe7.42C6 (or M23C6) phase.
The chromium carbide (M23C6) phase has an fcc structure, and the matrix has a bcc structure. These two structures should therefore be easily distinguishable during mapping. However, in reality this is not the case. Although the lattice parameters of these two phases are distinctly different as shown in the table below, the maximum intensity planes in both phases are very similar and therefore they are difficult to distinguish.
AZtec provides two possible solutions: (i) band width sorting, or (ii) capability to choose a defined set of reflectors for either phase. In this case the second option was used successfully.
Table 1: The Major Chemical Phases Identified in the High Temperature Steel
| Constituents | Quantification Atomic% 20kV, 70° tilt | Identified Phases | Crystal Structure |
| Matrix | Fe=76.85%, Cr=18.82%, Al=1.92% | Iron bcc | bcc: a=b=c=0.28nm |
| Grey intra-granular particles | Cr=47.8%, Fe=28.4%, C=23.8% | Cr15.8Fe7.42C6 | fcc: a=b=c=1.06nm |
| Dark large intra-granular particles | N=47.23%, Al=50.1% | AlN | hcp: a=b=0.3 c=0.495nm |
bcc= body centred cubic, fcc=face centred cubic, hcp=hexagonal close packed
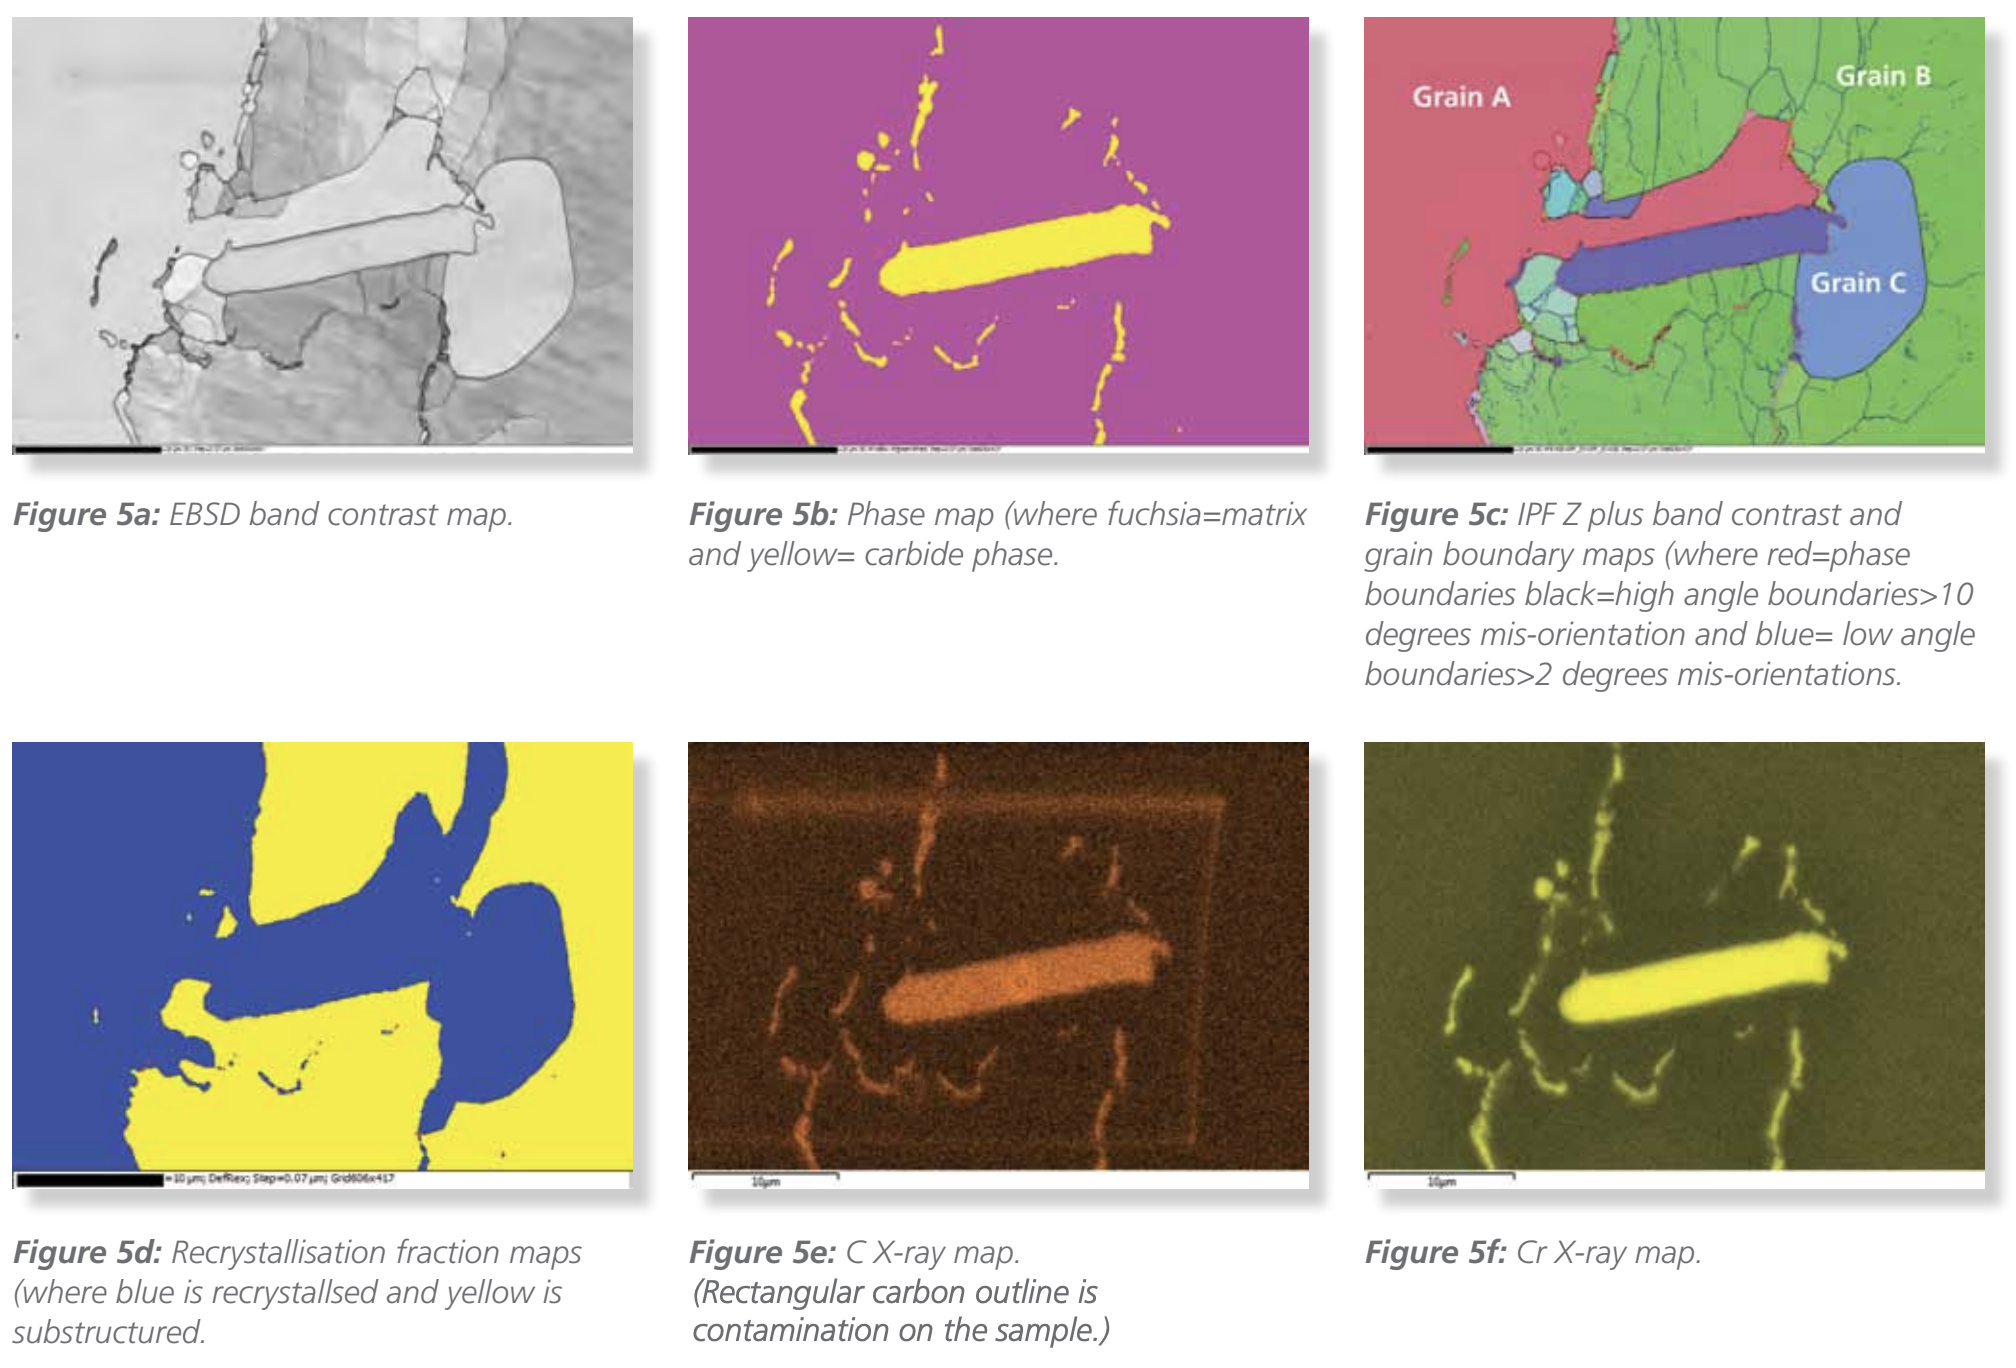
EBSD map data was collected from the different phases. Details of the analytical settings used for this acquisition are given in Table 2. Low magnification data was acquired to show the distribution of the coarser aluminium nitride and chromium carbide particles, while the higher magnification data was collected to investigate the fine grain boundary particles. The resultant maps are shown in a series of EBSD and EDS maps in Figures 3.
Table 2: Acquisition Settings for the EBSD Maps
| Map | Figure 3 | Figure 4 | Figure 5 |
| Mag (x) | x200 | x5000 | x3000 |
| Phases / no of reflectors | Iron bcc / 27; AlN / 43; Cr15.8Fe7.42C6 / 19 | Iron bcc / 27; Cr15.8Fe7.42C6 / 19 | Iron bcc / 27; Cr15.8Fe7.42C6 / 19 |
| Binning | 8x8 | 2x2 | 2x2 |
| Bands / Hough Resolution | 7 / 65 | 7 / 65 | 7 / 65 |
| Hit rate % | 99.1 | 96.8 | 97.1 |
Figure 3 shows the low magnification EBSD maps and EDS maps, which were collected simultaneously. This data is from the region shown in Figure 1. These maps show the clear alignment between the AlN and M23C6 particles indexed using EBSD and their respective constituent elemental EDS maps. Figure 3g is a layered EDS map of all elements present in the particle, illustrating the synergy between the EBSD and EDS maps.
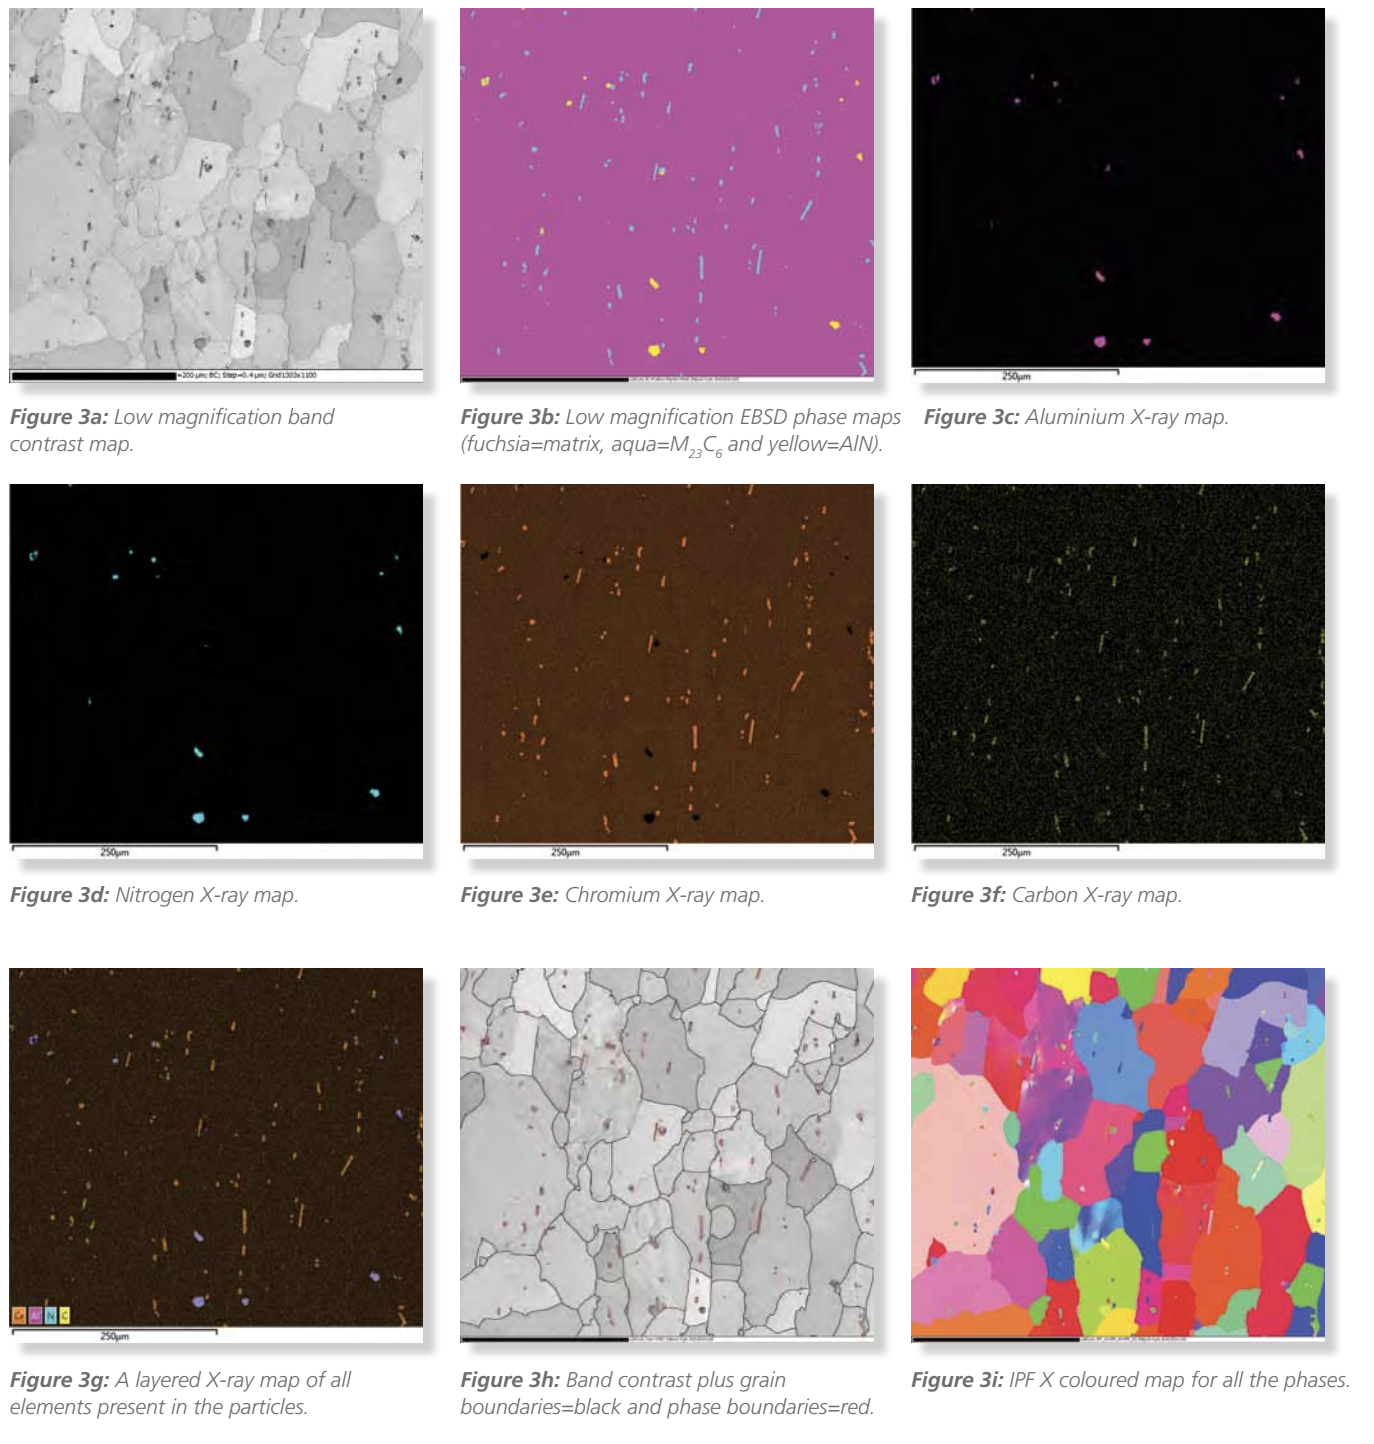
While Figure 3 is not necessarily statistically representative of the total microstructure of the plate, the phase boundary map clearly shows that most of these particles are intra-granular and have area fractions of 0.2% and 0.9% for AlN and M23C6.
The AlN particles range between 1 to 13 µm and the carbides from 1 to 11 µm in size; however, the former are almost equiaxed, while the latter are equiaxed to rectangular in shape with a large aspect ratio. The mean grain size of the ferritic grains in the mapped area is about 20 µm.
Figures 4a–b show an EBSD band contrast plus grain boundary map and a phase map collected from the fine grain boundary particles. The corresponding C and Cr X-ray maps are shown in Figures 4c and 4d.
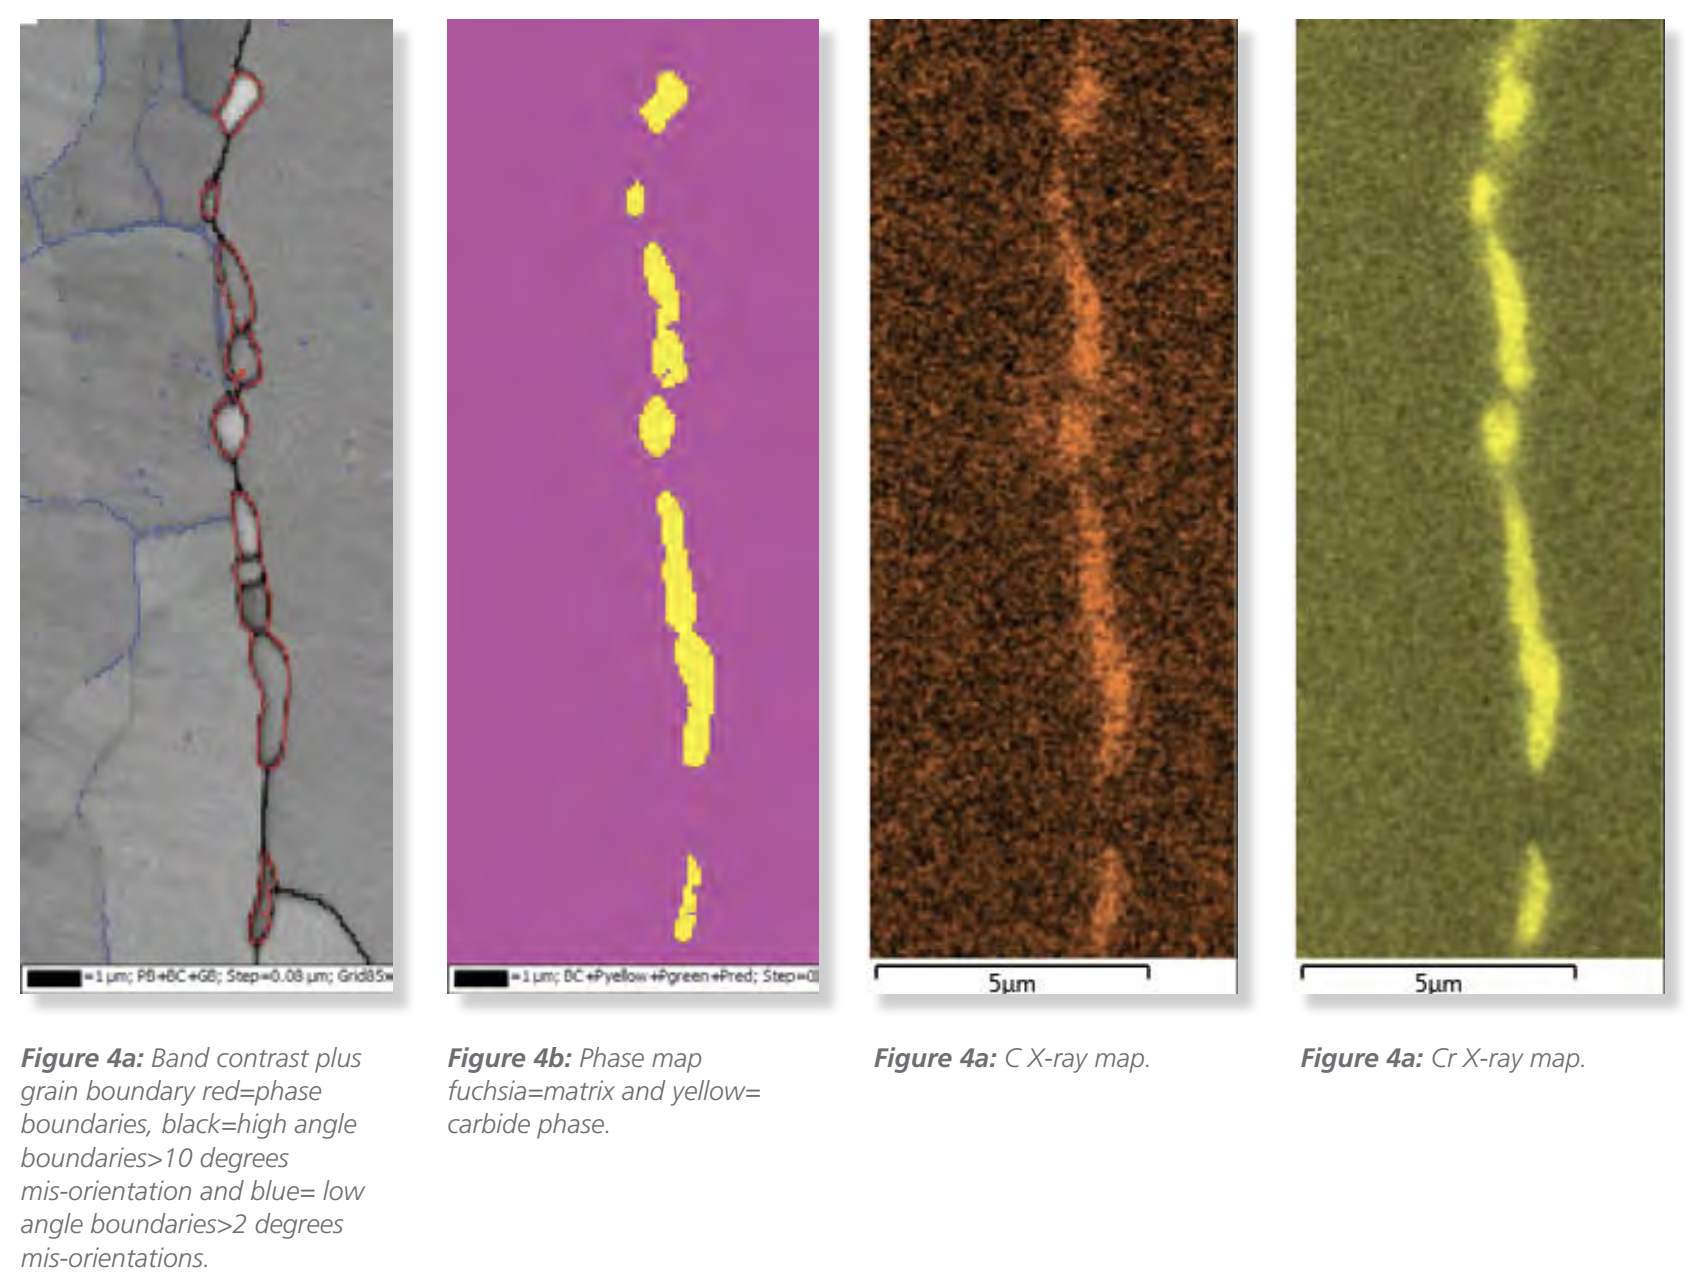
The low angle boundaries (delineated in blue in Figure 4a) were determined by applying the Kuwahara filter in the processing step. The Kuwahara filter is an edge preserving noise filter which reduces noise and enables the boundaries to be determined.
Figure 5 shows a series of maps from a region containing a large carbide particle with finer grain boundary particles. These maps illustrates how pinning of grain A has taken place due to the fine grain boundary particles and its migration into the recovered neighbouring grain across a region with fewer particles. Grain C may have been nucleated by the large carbide particle.
This example highlights how EBSD can be used to make detailed studies to understand the phenomenon of nucleation, recovery, recrystallisation and grain growth in the presence of second phase particles.
Conclusions
This application note illustrates the powerful capabilities of AZtec for characterising materials with more than one phase using a combination of EDS and EBSD. It illustrates the power of using the chemical quantification for searching the phase databases and EBSD patterns for positive crystal structure identification. The use with simultaneous EDS maps provides confidence in correct phase discrimination.
It also shows the power and flexibility of AZtec and Tru-I to accurately distinguish phases which have similar lattice parameters. AZtecSynergy makes combined EDS and EBSD a powerful yet easy to use tool for materials characterisation.

