Understanding how microstructures evolve during phase transformations is essential for optimising the performance of structural materials such as high-strength steel products. Electron Backscatter Diffraction (EBSD) is a widely used method for studying these transformations, as it provides orientation-resolved information on microstructural changes. However, identifying the precise moment when a transformation occurs and linking it to processing conditions remains challenging in dynamic experiments.
In this Application Note, we demonstrate how the Crystal Batch & Compare tools in AZtecCrystal 4.0 enable efficient in-situ EBSD analysis of displacive austenite-to-martensite transformation in steels.
These tools help users pinpoint the critical transformation temperatures, characterise the austenite parent phase and track microstructural changes across large datasets with consistent, automated processing.
Figure 1: Microstructure of 4N steel during austenite (orange)-to-martensite (blue) transformation.
Characterising Displacive Transformation in Steel Products
The displacive transformation of austenite to martensite upon quenching is a key mechanism controlling hardness, toughness, dimensional stability, and overall mechanical performance in steel products. For manufacturers, understanding the high-temperature orientation and grain size of the parent austenite – captured as Prior Austenite Grain Size (PAG) – is central to refining processing parameters and achieving the desired balance of strength and flexibility.
Since this transformation follows defined crystallographic orientation relationships, the parent austenite phase can be reconstructed from the martensitic microstructure, a process known as Parent Grain Reconstruction (PGR). However, multiple theoretical orientation relationships exist, introducing a level of uncertainty and trial-and-error when selecting the most appropriate one. Without direct high-temperature measurements, validating reconstructed parent phases is challenging. Advances in in-situ SEM heating stages now allow researchers to observe microstructural evolution at high temperatures, enabling direct comparison between predicted and experimentally measured parent phases [1].
Challenge
Capturing the critical moment during a dynamic in-situ transformation process is often both time-consuming and difficult. Time-lapse-based experiments may generate dozens or even hundreds of EBSD datasets, each requiring cleaning, processing, and reconstruction. In addition, structural data must be accurately linked to external parameters such as temperature or time. Here, we employ the Crystal Batch & Compare tools in AZtecCrystal 4.0 to automate and synchronise structural data analysis with experimental conditions.
Experimental Procedure
EBSD datasets were collected on a SA508 Grade 4N martensitic steel sample heated to 850°C using a NewTec FurnaSEM stage inside a TESCAN CLARA SEM. Automated data acquisition was coordinated through Manchester developed software, synchronised with the Oxford Instruments Symmetry S3 detector and AZtecHKL. Data analysis and Parent Grain Reconstruction were performed in AZtecCrystal 4.0. The PGR method is based on work by Huang et al. [2], using the Kurdjumov–Sachs orientation relationship (FCC {111} || BCC {011}; FCC <101> || BCC <111>), applying a 5° threshold angle and a 10° refinement range. Recorded stage temperatures were added directly to each EBSD map using the Stamp tool in AZtecCrystal.
Results
Data Processing Workflow
To track the austenite-martensite transformation processes within the 4N steel sample, a total of 91 EBSD datasets were collected throughout the entire high-temperature cycle. Using the Stamp tool in AZtecCrystal 4.0, each dataset was automatically linked to its corresponding temperature information recorded by the heating stage. This ensured that every map in the time-lapse series carried fully aligned structural and experimental data.
To handle the large datasets consistently, Crystal Batch was used to clean and process all 91 EBSD maps using a custom analysis template imported from AZtecCrystal Data Analysis. This workflow produced inverse pole figures (IPF) and phase maps for the entire time-lapse sequence within minutes (Figure 2).
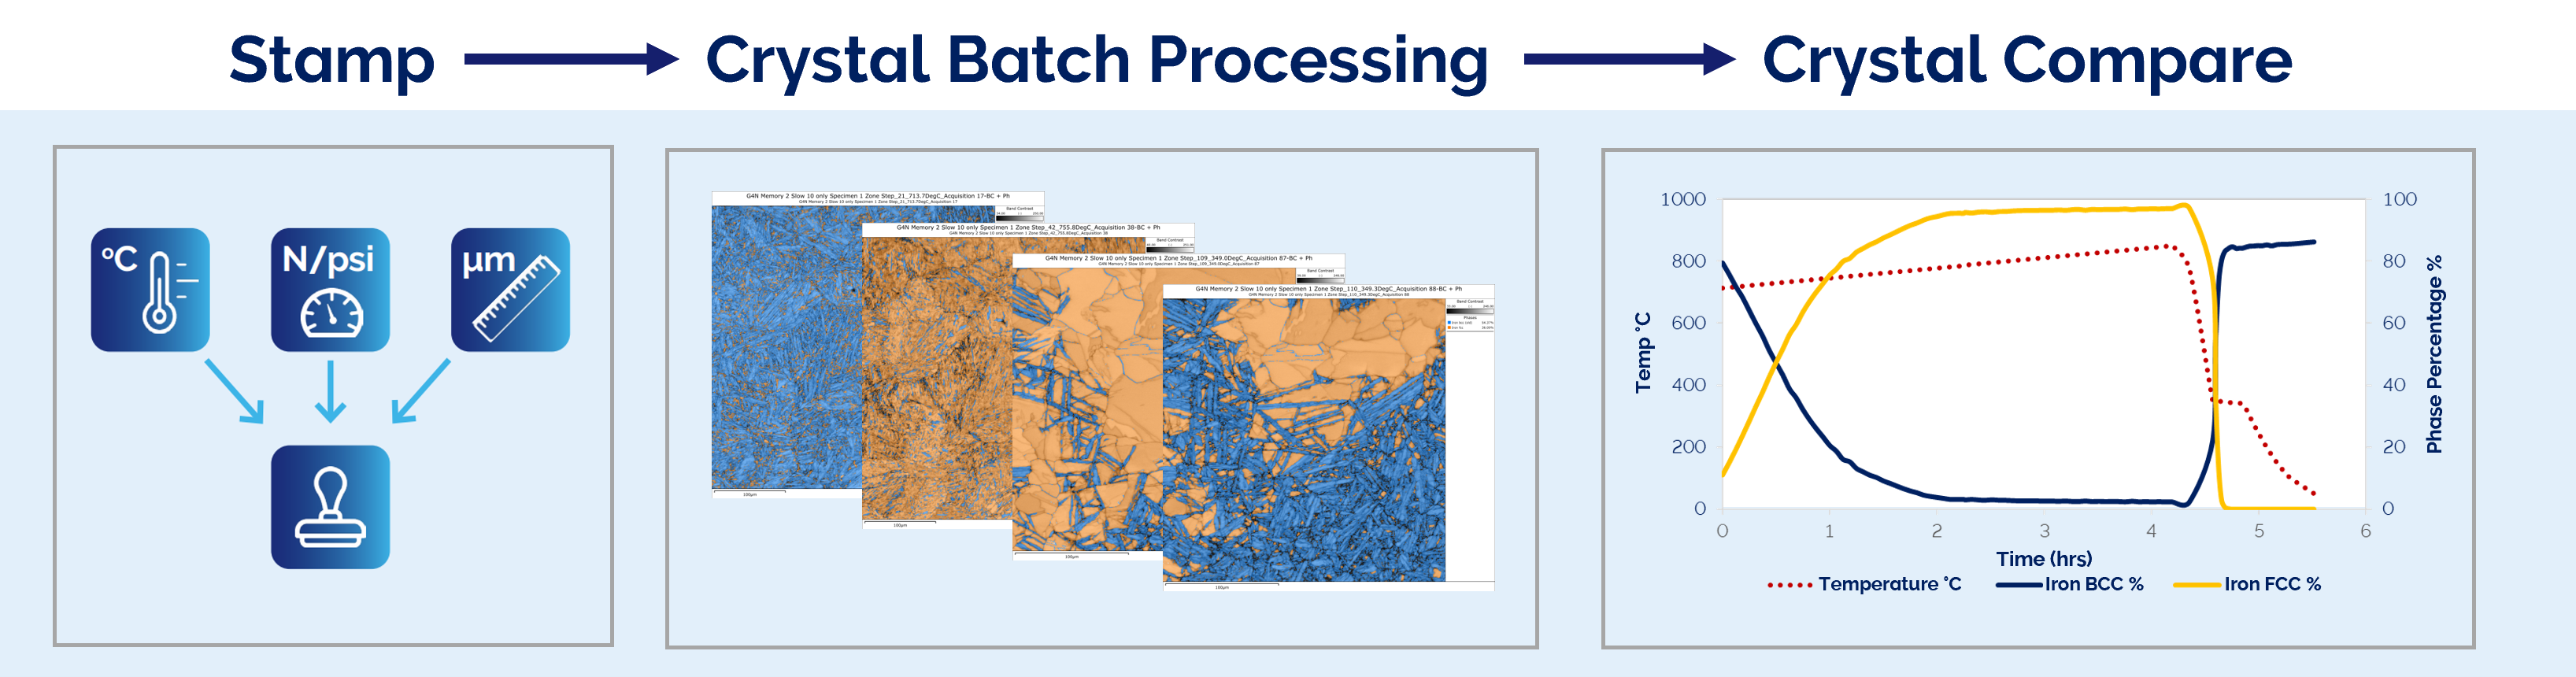
Figure 2: Example workflow of processing in-situ experimental time-lapse data. Left: Stamping of in-situ temperature data into H5OINA files; centre: batch processing phase maps; right: visualisation and interrogation of the data stack linking experimental parameters to measured EBSD metrics.
Tracking Microstructural Changes
Once processed, the full data stack was evaluated in Crystal Compare to trace how the microstructure evolved during heating and cooling. By plotting the phase fractions of FCC (austenite) and BCC (martensite) against temperature, it was possible to follow the displacive transformation continuously throughout the experiment. The transformation curve, together with selected maps shown in Figure 3, illustrates the temperature range in which the BCC-to-FCC transition accelerates and eventually completes (713°C–760°C).
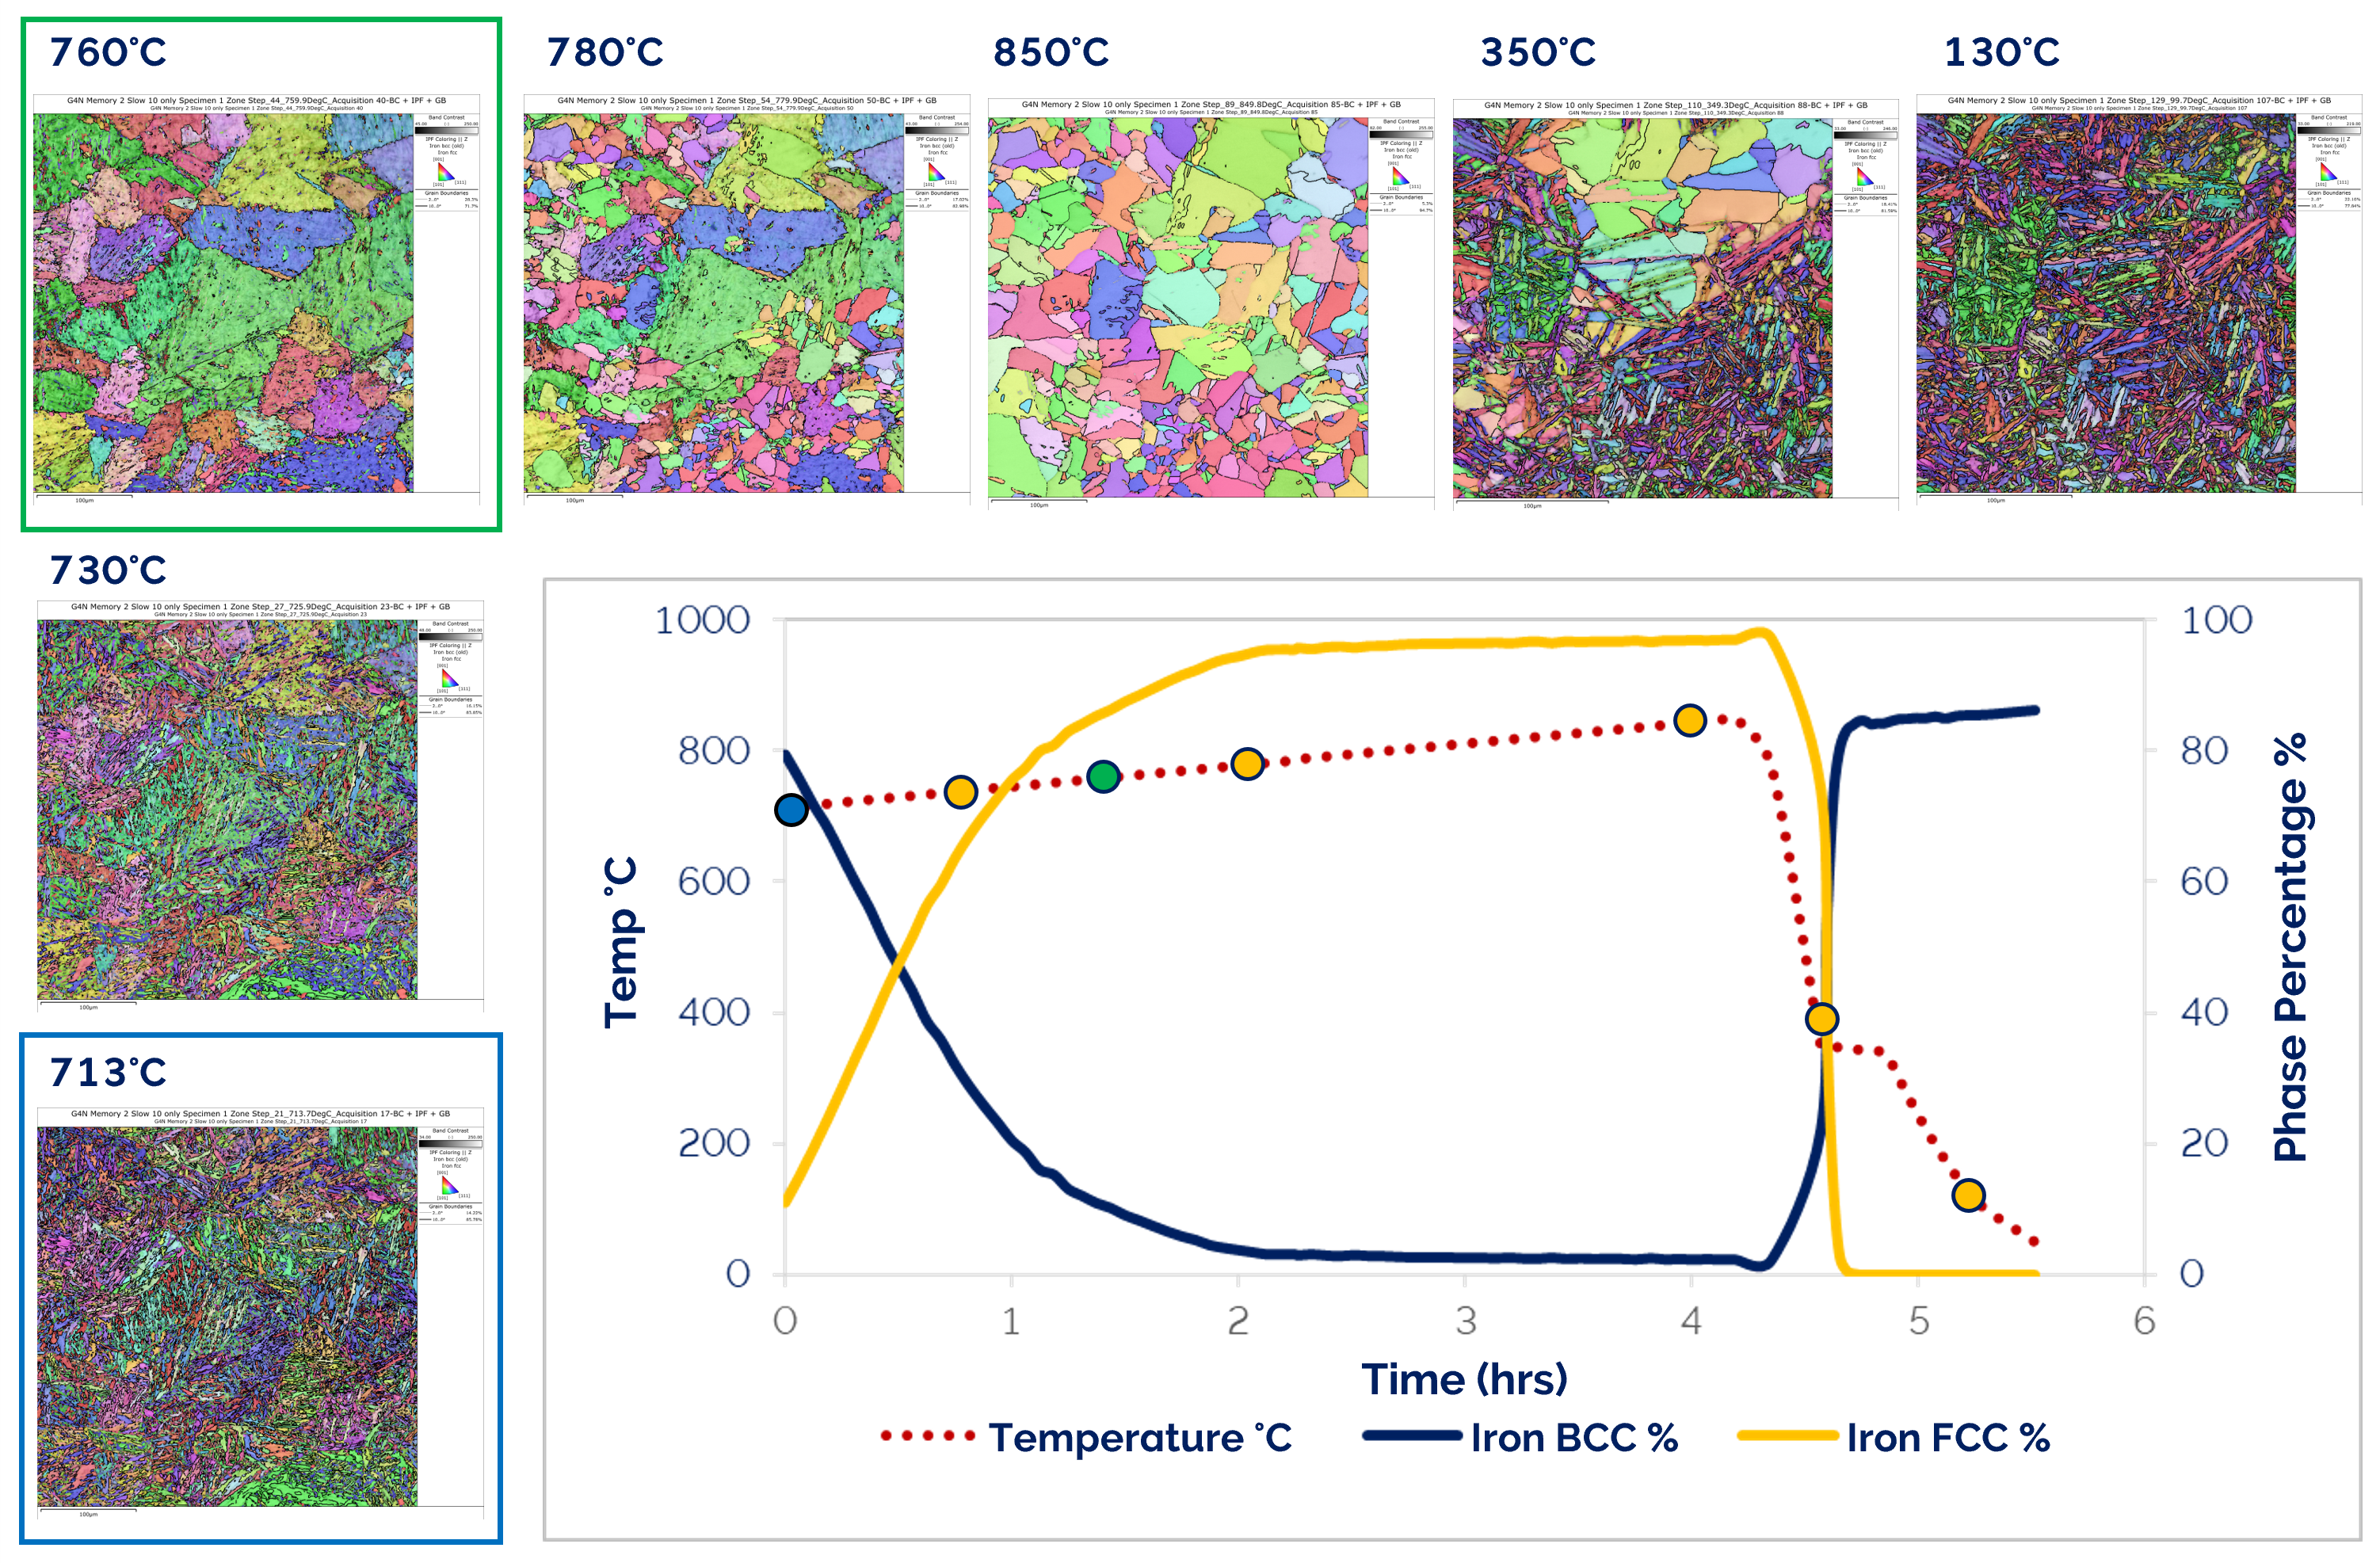
Figure 3: Histogram (inset) output from Crystal Batch & Compare showing phase fraction as a function of temperature, with (surrounding) corresponding microstructures from key moments during the in-situ experiment.
A summary of the key microstructural states observed during the heating experiment is presented in Table 1. At 760°C, corresponding to 86 minutes into the heating sequence, the sample reaches its critical stage where most of the BCC phase has already transformed to FCC, while secondary recrystallisation and grain growth have not yet begun.
Table 1: Summary of microstructural changes during the in-situ heating experiment shown in Figure 3.
| Temp °C |
BCC Phase % |
FCC Phase % |
|
| 713°C |
76.4 |
11.5 |
Starting BCC microstructure |
| 730°C |
47.5 |
46.0 |
Phase change from BCC to FCC on heating |
| 760°C |
11.9 |
83.6 |
Phase change to primarily FCC microstructure |
| 780°C |
4.6 |
92.9 |
Start of secondary recrystallisation of FCC grains |
| 850°C |
2.9 |
95.9 |
Secondary grain growth of FCC grains |
| 350°C |
52.6 |
35.7 |
Beginning of BCC phase change on rapid cooling |
| 130°C |
81.5 |
0.14 |
Phase return to BCC on cooling |
Comparison of Experimental Data with Parent Grain Reconstruction
In the next step, an EBSD map of the martensite phase recorded prior to the austenite formation (at 713°C) was used to predict the parent austenite microstructure via PGR. This reconstructed FCC phase was then compared directly to the measured FCC microstructure at the identified critical temperature of 760°C.
As shown in Figure 4, the predicted and measured microstructures show excellent alignment. Major grain boundaries, crystallographic orientations, and overall morphology align closely, validating the experimental observations. Additionally, the results confirm that the chosen PGR approach reliably captures the transformation behaviour of this steel.
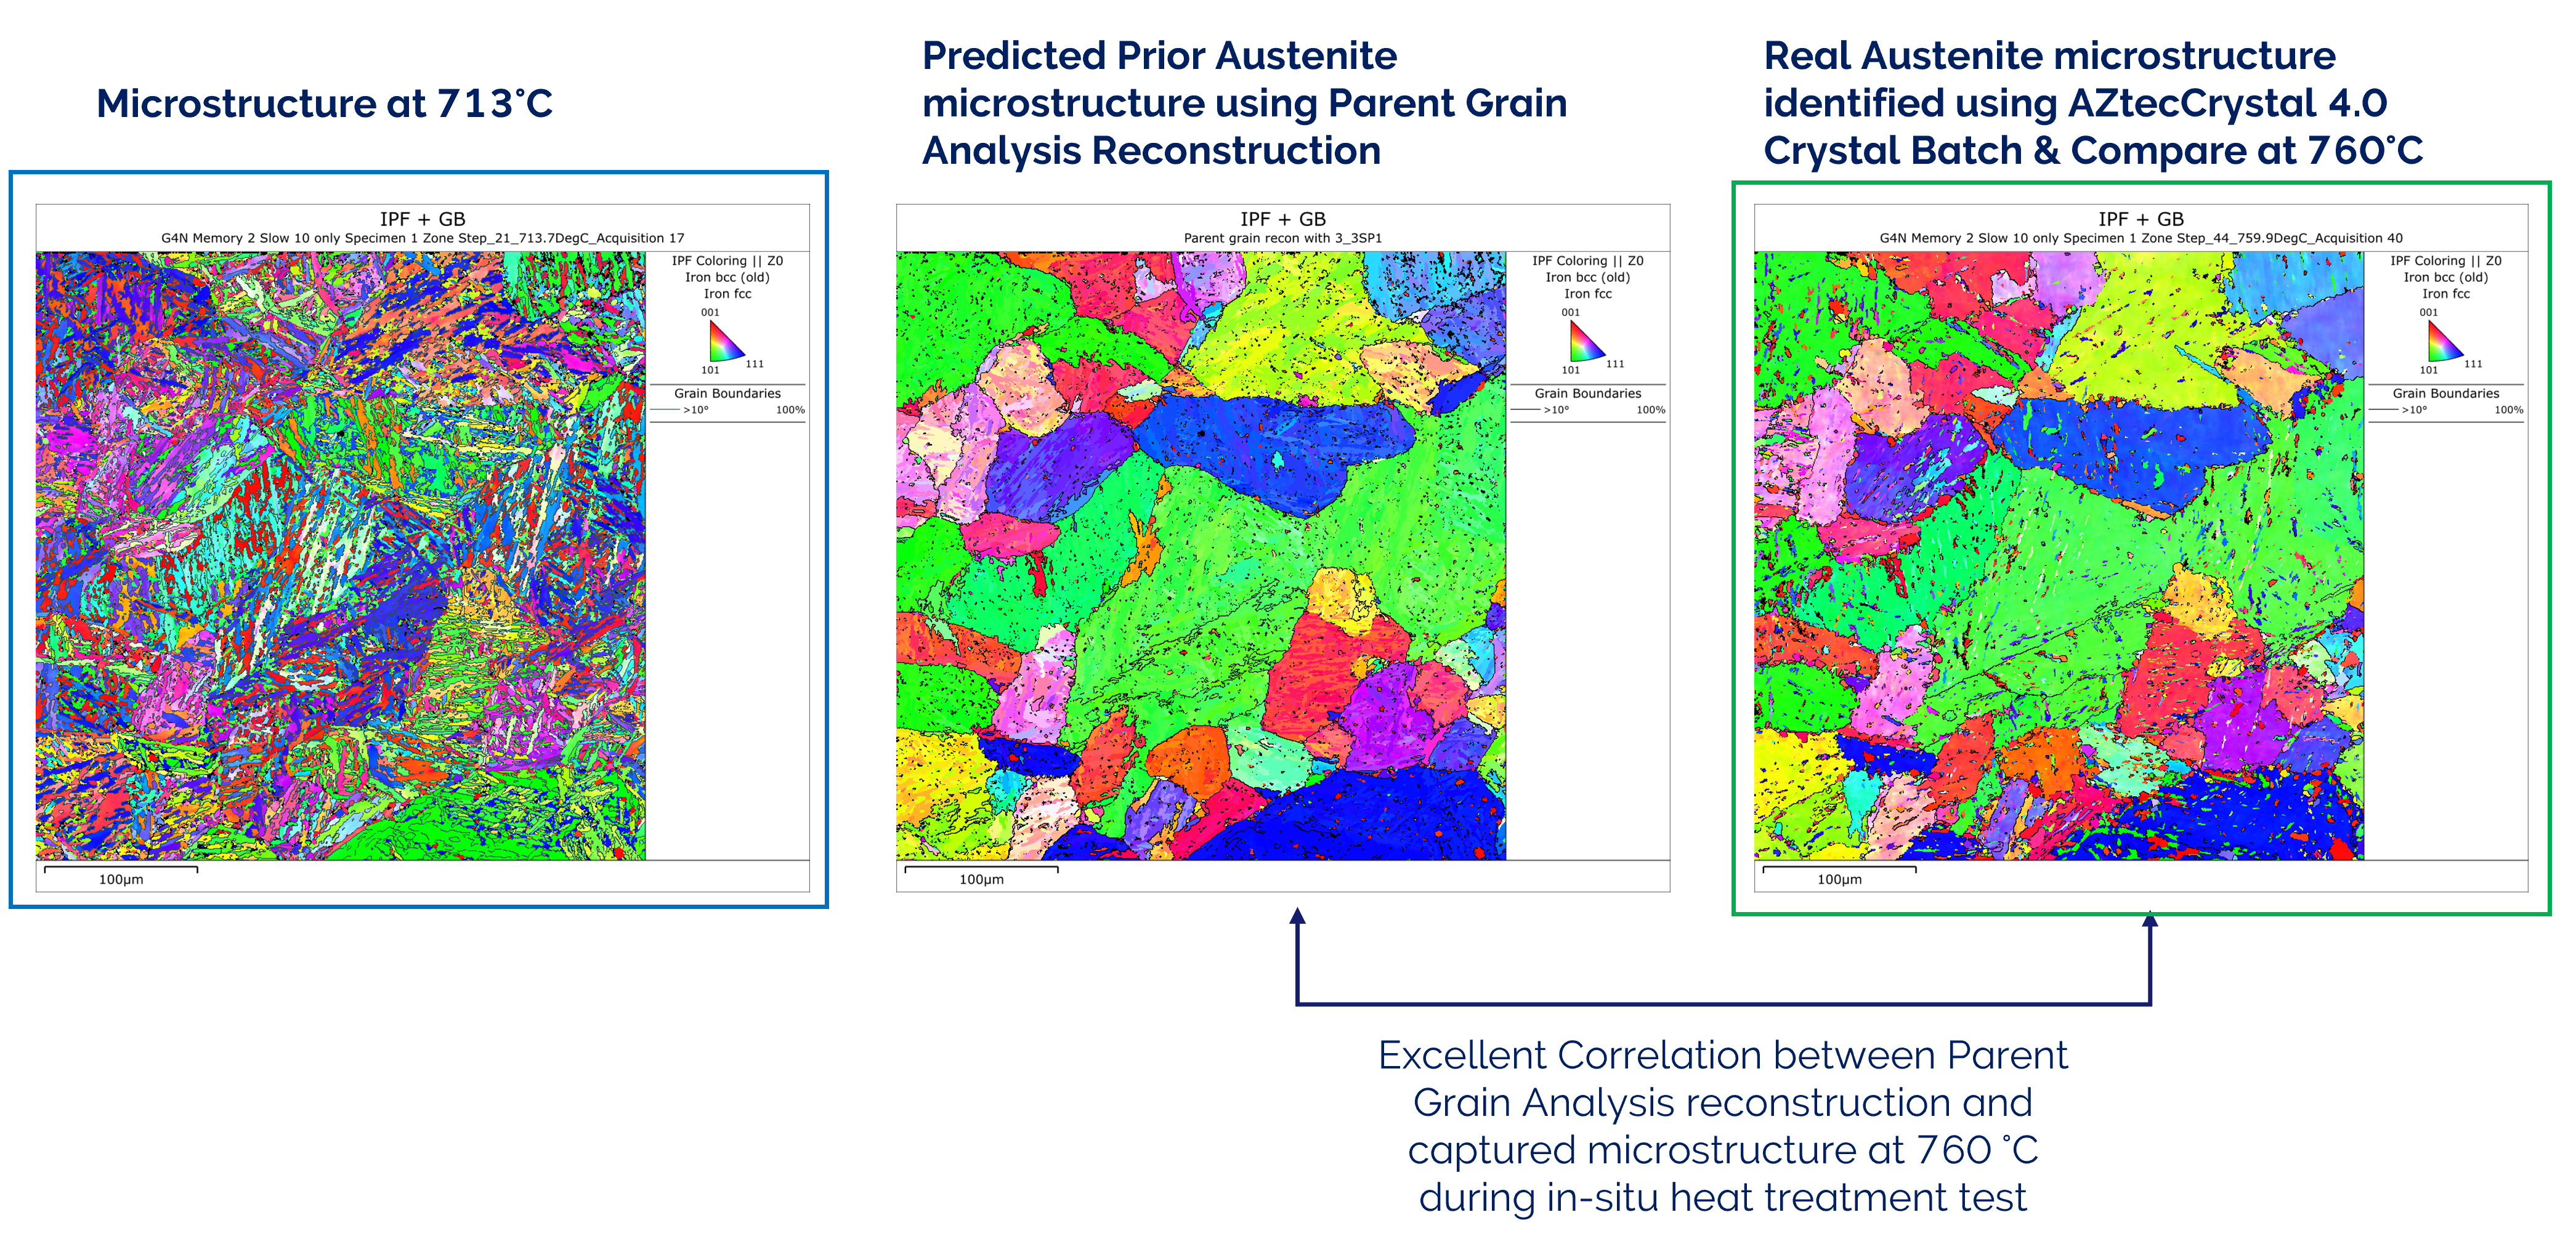
Figure 4: Left: starting microstructure used for Parent Grain Reconstruction; centre: predicted austenite FCC microstructure from PGR; right: measured austenite FCC microstructure at 760°C showing the phase transformation largely prior to secondary recrystallisation and grain growth.
Conclusion
The new Batch & Compare capabilities in AZtecCrystal 4.0 provide a streamlined and fully integrated workflow for analysing large in-situ EBSD datasets and automatically linking structural information with external experimental parameters. This workflow enabled a clear investigation of the phase changes and recrystallisation behaviour of an SA508 Grade 4N martensitic steel sample during heating and cooling.
Using these tools, the critical transformation temperature was successfully isolated and examined in detail. At this key temperature, the predicted austenite parent phase reconstructed using PGR demonstrated excellent agreement with the directly measured high-temperature microstructure. This outcome confirms both the reliability of the reconstruction approach and the importance of real-time validation via modern experimental techniques.
Overall, AZtecCrystal 4.0 enables researchers to “capture the moment” during dynamic in-situ experiments, reducing manual processing effort and improving the confidence and clarity of phase transformation analysis.
References
[1] M. Taylor et. al, In-situ heating-stage EBSD validation of algorithms for prior-austenite grain reconstruction in steel, Scripta Materialia 242 (2024) 115924.
[2] C.-Y. Huang, H.-C. Ni and H.-W. Yen, New protocol for orientation reconstruction from martensite to austenite in steels, Materialia 9 (2020) 100554.
Acknowledgements
With thanks to Mark Taylor1, Albert Smith2, Jack Donoghue1 and Ed Pickering1.
1. University of Manchester and Henry Royce Institute
2. TESCAN UK

