Introduction
The technical cleanliness of components is crucial to their performance in finished products. As such, the assessment of the level of cleanliness of components is applicable in a wide range of industries, e.g. any involving the manufacture of mechanical devices such as the automotive industry. A typical example of such a component is ball bearings which are at the heart of almost every product with a rotating shaft.
The manufacture of bearings is a very precise process with, in some cases, very low tolerances being required. It is entirely possible for a particle of 5 microns or less to cause a precision bearing to fail; very small particles have the potential to cause major damage. Even if such particles are not the immediate cause of failure, they can decrease a bearing's smooth running qualities and low torque values and impact on its lifetime. Therefore it is important that a high degree of cleanliness is maintained during the manufacture of precision bearings. As a result, an assessment of cleanliness as part of quality control is crucial to ensuring consistent bearing performance. Residual particles may originate from the manufacturing or assembly processes or be introduced from the environment. In order to know if particle levels are within acceptable limits and in order to attempt to identify the source of particles, it is important to know both their composition and morphology so that the manufacturing processes can be monitored and optimised.
Historically, light optical microscopy was used to count and measure particles. This process requires time, limits the minimum particles size that can be detected and does not provide compositional information. The use of scanning electron microscope (SEM) and Energy Dispersive X-ray spectrometry (EDS) greatly improves the analysis as higher magnifications can be used and composition and morphology can be combined on a particle by particle basis. Furthermore, the data can be collected under full automation.
AZtecClean is an application of AZtecFeature which is optimised to perform technical cleanliness analysis to international standards such as ISO 16232 and VDA19. Here, we show an example of the use of AZtecClean to report on the cleanliness of a ball bearing manufacturing process to these standards.
Example: Technical Cleanliness in Deep Groove Ball Bearing Manufacture
Deep groove ball bearings are the most widely used type of bearing. Their applications include turbochargers for automotive and aerospace use, medical and dental equipment and high-speed machine tooling equipment.
Sample Preparation
A sample was prepared by washing a known volume of finished product. These particles were captured on a membrane filter, which was then attached to a sample stub and coated with carbon to minimise charging of the non-conductive filter material under the electron beam of the SEM.
Detecting Particles and EDS Analysis
The sample was imaged using the SEM's backscattered electron (BSE) detector. Contrast in BSE images is generated by the density of the phase, making BSE imaging ideal for determining particle locations. As the majority of particles are made of dense elements, they appear brighter than the background filter material in a BSE image as shown in Fig. 1.
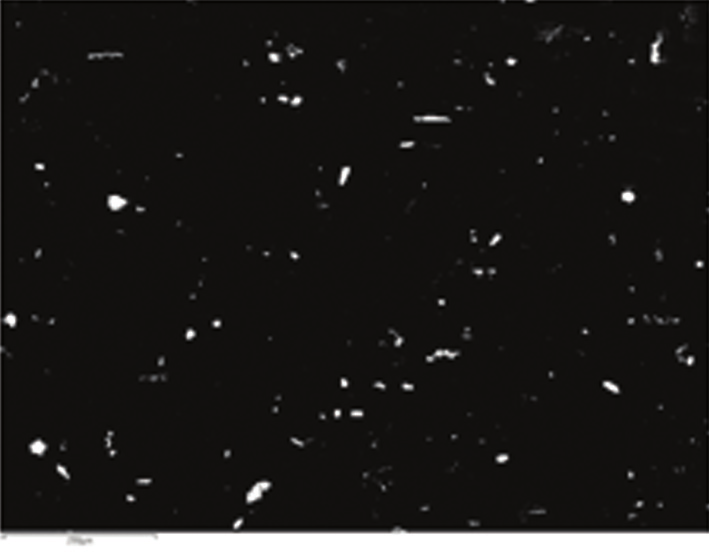
Fig. 1 BSE image showing particles on a filter.
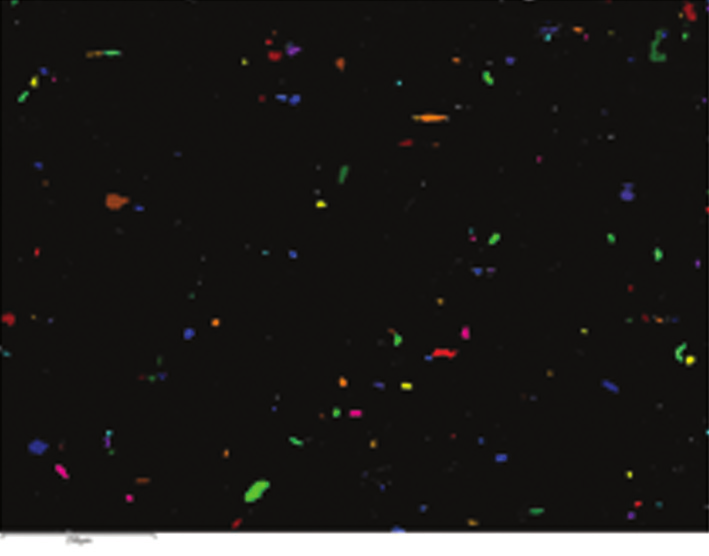
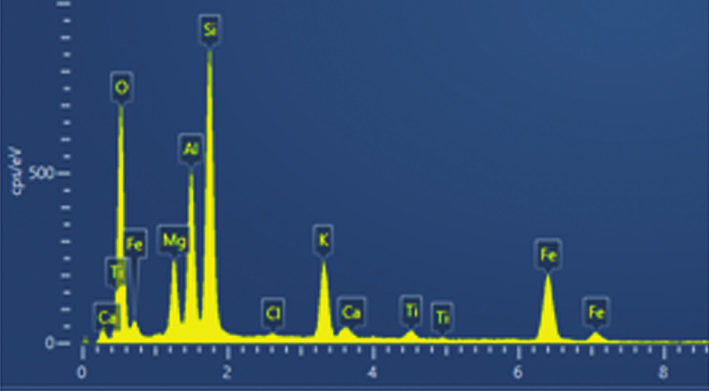
The particles were identified and separated from the dark background by means of a single grey threshold. This information was then used to determine where EDS measurements should be taken. The morphology of all particles falling in this threshold was measured automatically and instantly and was combined with compositional data from the subsequent EDS analysis (at 20 kV). Fig. 2 shows an example of a field of view where a number of particles have been detected.
(a)
(b)
Fig. 2. (A) Particles meeting detection criteria are detected and coloured. (B) Typical spectrum acquired from a silicate particle at 20kV
Automated Large Area Analysis
The entirety of a filter was analysed automatically with the results from each field combined into a single data set. The data shown in this application was obtained over a total circle area in excess of 506 mm² (with a diameter of 25.4 mm) at a pixel resolution of 1.15 µm. 31,249 particles were detected and analysed in real time.
Fig. 3 shows a montaged image of the large area. Particles are coloured by their classification.
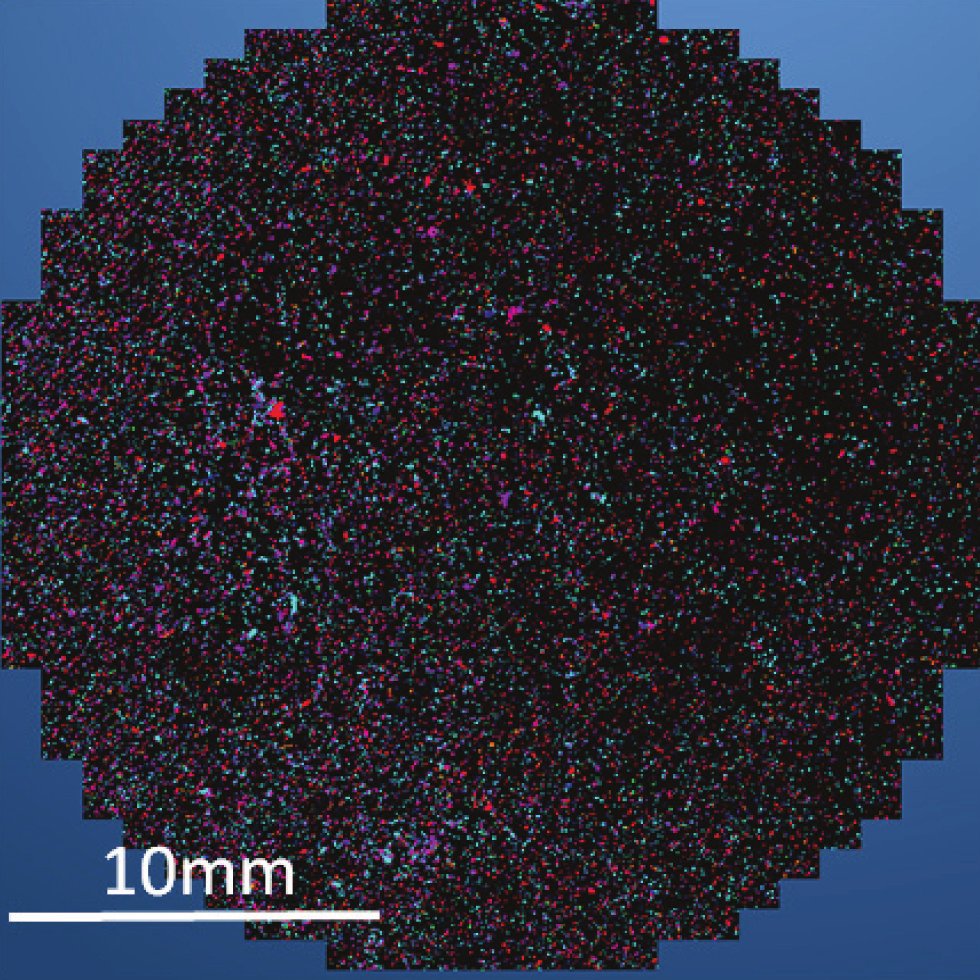
Fig. 3. Montaged Image of the Entire Filter Showing Detected Particles.
Classification and Report
As soon as the EDS data was acquired, it was quantified and classified by a dedicated technical cleanliness classification scheme in real time. Fig. 4 shows the classification totals for all particle types within the acquisition.
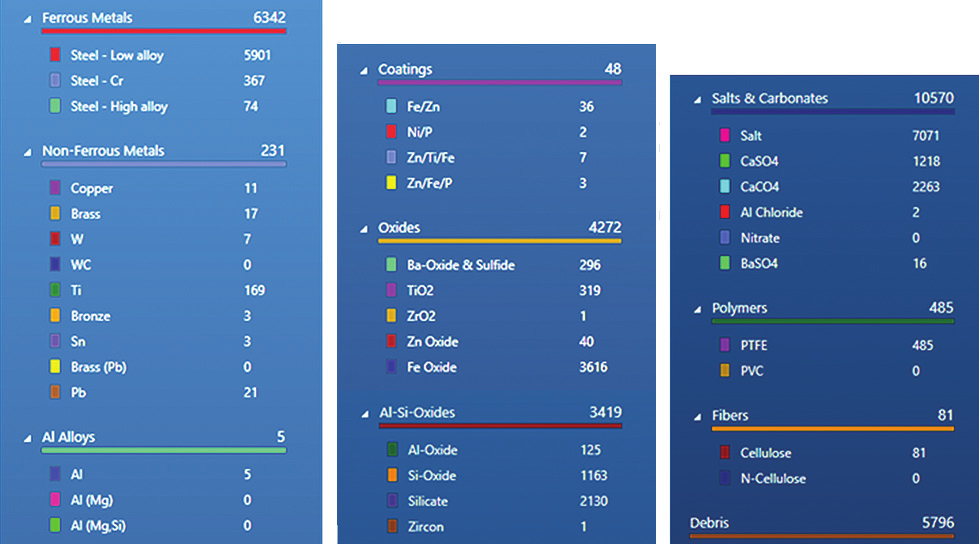
Fig. 4 classification totals and colour key for entire filter analysis run.
The 'component cleanliness reporting sheet' required to meet the ISO 16232 and VDA19 standards is generated automatically (Table 1). This reports both the total number of detected particles in each size bin but also shows the results split in the defined compositional classes.
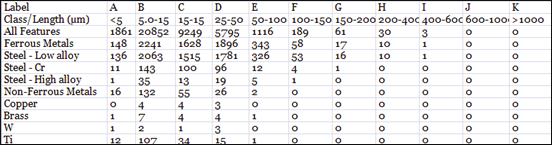
Table 1: Subset of Technical Cleanliness Results for this sample reported to the size bins defined by ISO16232 and VDA 19.
Component cleanliness code (CCC) per wetted volume or area may be calculated from this data. The CCC for this example is:
CCC=V (B15/C14/D13/E11/F8/G6/H5/I2/JK00)
Separation of Features that cannot be Separated with BSE
In an ideal case, when samples of this sort are prepared, particles will be evenly distributed over the whole surface of the filter without any touching one another or overlapping. When this is the case, contrast and brightness can be set so that all particles can be easily identified by their grey level and analysed individually.
However, in practice, it is often difficult to avoid having any touching or overlapping particles. Multiple phases may have similar grey levels, meaning that when they overlap it is impossible to separate them from one another by their grey levels. Alternatively, it may be that when contrast and brightness are set for one group of particles, another group becomes saturated. Fig. 5a shows an example of this — it appears from the BSE that a single particle is present. It is impossible to know if this is an agglomerate of multiple particles or a single particle.
AZtec FeaturePhase offers a solution to this problem. EDS maps can be collected from the pixels within the grey level threshold that identifies these particles. By mapping only these pixels a large amount of time is saved compared to mapping an entire field (i.e. no time is wasted mapping the mounting medium). A robust, automatic phase identification algorithm analyses these maps to identify phases which are then extracted as features. These features have their morphology measured, their composition quantified and are classified.
By utilising FeaturePhase to analyse the particle in the centre of Fig. 5a, it is possible to determine that two phases (steel & silicate) exist within the particle, as shown in Fig. 5b. This information would have been lost without FeaturePhase.
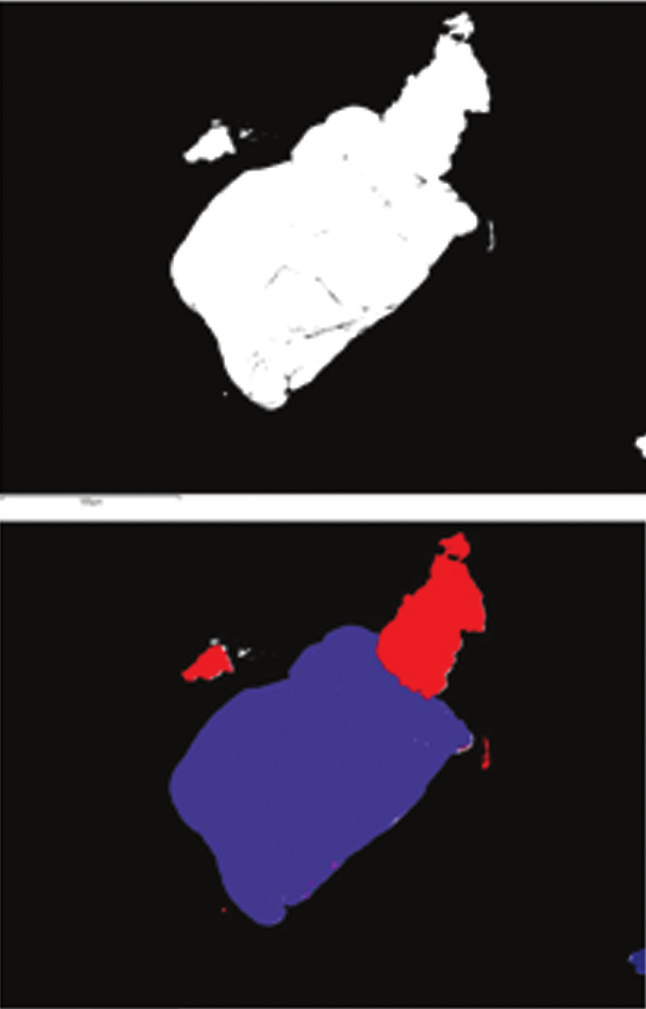
Fig. 5. A saturated particle – It appears from the BSE image (A) that one particle is present when in actuality, when it is mapped and processed with FeaturePhase (B) there are two.
Conclusion
AZtecClean is a powerful tool for enabling the quick and accurate characterisation of technical cleanliness samples. By utilising large area EDS detectors a high throughput can be achieved with a full particle by particle compositional and morphological characterisation made. This allows for the calculation of comprehensive summary statistics for the sample in accordance with international technical cleanliness standards. The use of a dedicated classification scheme and reporting with pre-optimised settings ensures that data is consistently and reliably acquired in accordance with these standards. As part of AZtecClean, FeaturePhase enables phases which are difficult to distinguish by normal means to be automatically and accurately separated.

