4th August 2021 | Author: Kim Larsen
Large Area Mapping of EBSD samples
Large Area Mapping (LAM) is a functionality within AZtec which allows a single field data acquisition (an image acquisition or mapping) to be repeated over many neighbouring fields to cover a large area. In this way it is possible to get a dataset which has high spatial resolution while at the same time providing a low magnification overview by combining beam scans and stage movements. For EDS analysis on flat samples this functionality is easy to use at the recommended EDS analysis working distance. However, EBSD analysis is done at high tilt, typically 70 degrees, which means that there are some considerations one must make before collecting data, such as:
- How to position or orient the sample on the stage or sample holder
- Which working distance to use?
- Which magnification to use?
- Potential calibration steps
Orientation of the sample
During the data acquisition, AZtec is moving the sample from field to field automatically, so it is important that the sample is positioned in a way so that these movements are safe. During the initial setup, typically 4 points are defined on the sample surface (x,y,z) allowing AZtec to calculate how the z-axis on the stage should be adjusted to keep the sample surface in focus while moving the x,y axis to shift the stage between fields of view. This is important, as otherwise the sample would potentially move out of focus if the sample surface was not mounted parallel to the SEM stage.
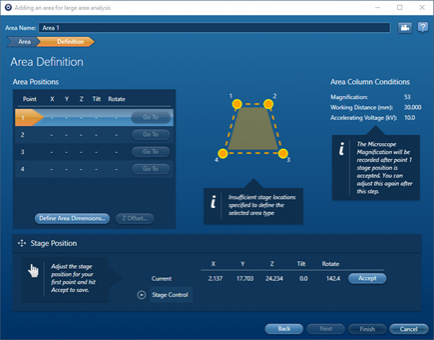
Figure 1 - Setup wizard for AZtec LAM
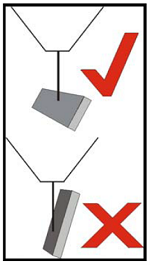
It also means that if you work with elongated samples or sample mounts, it is an advantage to mount the sample so that the longest direction is along the tilt axis. This will reduce the amount of movement towards the polepiece and thereby make it safer to move the sample around inside the SEM chamber. It is worth remembering this if you use pretilt holders, as it will help to reduce the required z movements. The recommended sample orientation is illustrated on figure 2 below.

Figure 2 - Recommended orientation of elongated sample in the SEM chamber.
Working Distance
Typically, we choose a working distance based on the required spatial resolution of the analysis or a general recommended working distance based on the position of the installed detectors. However, for Large Area Mapping, we also need to consider safety and the space required for moving the sample. During the data acquisition the working distance is kept constant. This means that the analysis must take place at a WD which allows for the sample to be moved enough to cover the desired area. Typically, the analysis of a large sample will require the use of a longer WD than the analysis of a small sample. The actual values will depend on the SEM (shape of pole piece) and setup (detectors), but as a rule of thumb, the minimum WD will be (approximately) equivalent to the width of the sample. Again, think about the orientations illustrated on figure 2.
Often, this means the use of a longer WD than desired based on the detector setup, however that is not a problem as the elevation control of Symmetry detector can be used to reposition the detector and get a good acquisition geometry at a longer WD. Using the elevation control can also be a way of increasing the signal towards the EDS detector if the two are being used at the same time. This has been shown in an earlier blog post by Dr Pat Trimby.
Magnification and intensity considerations
For single field analysis, the magnification is chosen based on the required spatial resolution in the data and on how large the area to be analysed is. The lowest practical magnification is generally limited by the SEM column and potential low magnification distortions. When mapping large areas, it is important to consider magnification in relation to the mapping data, particularly if EDS data is being collected at the same time.
Due to geometry, the EDS intensity will change across a single field of view, which means that if adjacent maps are montaged, there can be visible intensity differences between the maps. This effect is normally not observed if EDS data is collected at 0 tilt at the recommended working distance for the EDS detector, as the intensity change is symmetric around the centre of the field of view. By using a different working distance and working at high tilt, this symmetry is no longer maintained, and the count rate variation becomes visible as the solid angle changes.
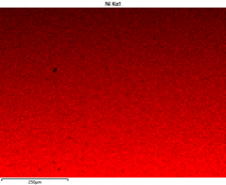
This is not always a problem for the analysis; however, we can reduce the effects by either working at a higher magnification, by retracting the EDS detector or by using a collimator with a large opening – all helping to reduce the changes in solid angle within each field. Additionally, consider the position of the EBSD detector relative to the sample. The EBSD detector can also end up shadowing the EDS signal and thereby creating a gradient which will show high intensity at the physical top of the sample and reduced intensity as the beam is moved physically downwards on the tilted sample – see figure 3.
Consider also that similar effects can be seen on electron images in some cases due to the detector positions.

Figure 3 - Count rate difference due to geometry effects, notice that the beam is scanned from the lower part of the sample and upwards, resulting in higher count rates at the top of the field of view.
The fastest way to find the best compromise in terms of magnification and detector positions is, generally, to acquire a small test map and compare the element map intensity at top and bottom of the maps and images.
Alignment between fields
For AZtec to be able to collect data from adjacent fields with a defined overlap, it is important the length scales and stage movements are correctly calibrated. This is generally not something you need to worry about as a user as this will have been done during system installation. What you do need to ensure is that AZtec knows the sample tilt as this information is used to calculate the length scale and thereby movements of beam and stage in the direction perpendicular to the tilt axis.
On some systems the relation between the beam scanning direction and the stage movement direction is not constant but changes with working distance and kV. Thereby it can change between experiments as SEM conditions are changed or it might have changed compared to when the system was last calibrated. If this relation (scan rotation) is not constant, then it will be visible in the montaged data as fields next to each other will be offset as illustrated in figure 4.
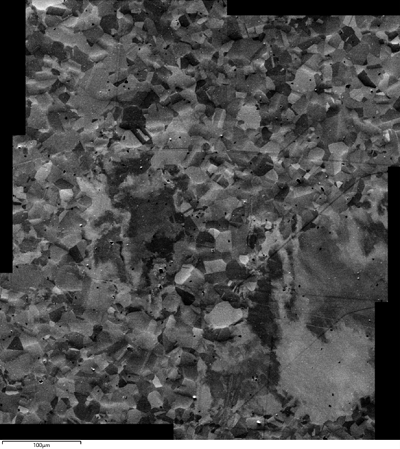
Figure 4 - Misalignment of fields due to scan rotation change (notice the steps at the edge of the 2x3 montage)
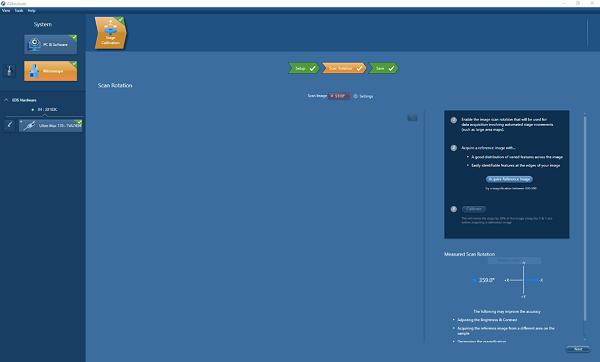
To overcome this issue, there is a user-facing calibration step, where a feature on the sample is tracked, while the stage is moved in the x direction. This step can be accessed from the Assist software, however on most systems this is not a requirement, as the SEM automatically adjust the scanning direction based on the SEM calibration data. Additionally, for EBSD analysis, we adjust scan rotation corrections as part of the sample alignment process in order to ensure that absolute orientations are correct, which also ensures that the alignments between fields are maintained for Large Area Mapping.

Figure 5 - User facing stage calibration step, where sample is moved along one axis and image correlation is used to identify the relation between stage x,y movements and the orientation of the electron image.
Large Area Mapping is a useful acquisition feature that allows you to generate a low magnification overview of a large area whilst also maintaining a high spatial resolution. This post has hopefully provided a good overview as to the problems that you would encounter when performing Large Area Mapping using EBSD, and how to combat them.