3rd March 2021 | Author: Dr Louise Hughes
A step by step guide for correlative data analysis
Correlative microscopy is an exciting technique with several challenges in both the acquisition and analysis of data. Relate, our correlative data analysis software, enables you to correlate images from a wide range of microscopes with flexible display options for viewing multiple images together. It provides access to the quantitative information available with analytical microscopy techniques, for example, measurements from atomic force microscopy (AFM) or x-ray counts from energy dispersive x-ray spectrometry (EDS).
The processing and analysis of correlative data involves multiple steps. Several of these have been covered in our webinar, tutorial, and on our Relate webpage. Workflows are key to establishing efficient data analysis. Below is an example workflow with a few tips and tricks for each stage.
1. Rename studiables
Rename studiables and layers within your files using the STUDIABLE menu. This makes it easier to select the right files and layers in subsequent steps.
Image showing screenshots of dialogue boxes allowing you to select different studiables and different layers within the studiable (left) and images from studiables with the shown layers information and the names of thumbnails (right). Renaming these layers at the start makes selection further down the workflow much easier.
2. Optimise your data
Once imported there are several functions in the OPERATORS menu that enable you to get the best from your data and make it easier to align files from different imaging modalities.
- Ensure that the pixel size and the units for your images are correct. This can be adjusted if necessary, using the EDIT AXES operator. Make sure you adjust both the x and y axis before clicking ok.
- Correct any artefacts such as underlying gradients in AFM data using the LEVEL functions.
- Adjust the orientation of images by rotating or mirroring them. This is particularly important if your data is flipped when moving between different types of microscope.
- Crop your data using the EXTRACT AREA function. This step can also be done after correlation of data sets and is useful when you want to create a new centre point around which your 3D data will rotate.
3. Correlate your datasets
There are some simple functions that can help with your data correlation.
- Click FULL SCREEN to expand your colocalization studiable to the whole screen, making the correlation of layers much easier.
- You can select or add several datasets to your colocalization studiable either during initial set up or by using the ADD OVERLAY function. Adding them sequentially can make the correlation of individual datasets easier.
- When adjusting while correlating several files, make sure you only have the layers you want to adjust selected. This can be done by using the scroll wheel on your mouse to zoom out, left clicking on an empty area then selecting the layer that you want to work on.
- You can organise the layers being shown and bring them forward or backwards within view using the ORGANISE function.
- Use the TRANSPARENCY function to change the transparency of your layer when it is stationary. This makes a big difference when checking to see how well your data is aligned.
- Deselect the RECTANGULAR function if you need to adjust your data to account for skew. Select it if you need to maintain 90-degree angles.
- If you make a mistake, use RESET SIZE to quickly return your data to the original size and shape.
Once done make sure you EXTRACT ALL to produce a multilayer studiable containing all the layers of your correlated data. Alternatively, use EXTRACT SELECTION if you have layers that were important for alignment, but which are no longer required for subsequent analysis.
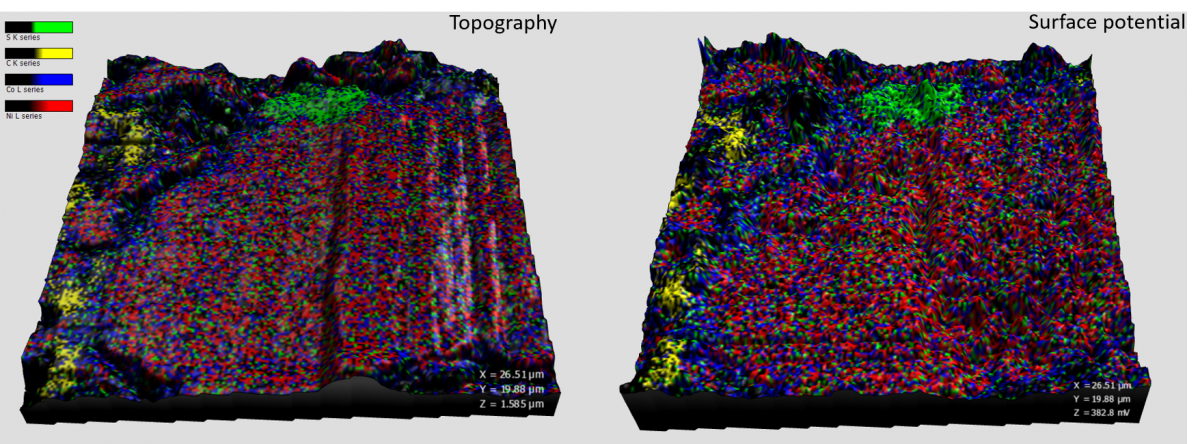
Image showing EDS maps of a battery sample displayed using different AFM measures for the height. Topography (left) and surface potential (right).
4. Enhance the visualisation of your data
Enhance the visualisation of your correlated data using these simple tips.
- Fast optimisation of brightness and contrast across all layers can be done by going to the ENHANCEMENT drop down menu and selecting OPTIMISE.
- Each layer in your data can have a unique palette by selecting from the drop-down PALETTE menu. These palettes can be edited by double clicking on the arrows on the colour scale bar within your studiable. You can save any palette to be used another time in the PALETTE menu.
- COLOUR MIXING found in the COMPOSITE(?) RENDERING drop down menu can be used to optimise the blending of multiple layers, to adjust the transparency of each layer and add a background image (for example an SEM image).
- To display your topographic data with isotropic voxels, go to the AMPLIFICATION drop down menu and select NORMALISE IN X, Y and Z.
- Any layer can be used to generate topography by selecting it from the TOPOGRAPHY LAYER drop down menu. This can lead to some interesting visualisation of data correlations.
Image of coloured multi-layered profiles showing the wt% of oxygen (red) and aluminium (green) against the topography (black). The position of the profile line is shown in the 3D data display at the bottom.
5. Optimise the measurement and display of quantitative information
- To display EDS data from zero x-ray counts or zero wt% to the maximum values in profiles, you will need to adjust the AXES SETTINGS and set other layers to RELATIVE: IN HEIGHTS.
- The colour and thickness of lines on multilayer profiles can be changed using PROFILE COLOURS on the MULTILAYER VIEW drop-down menu.
- Measurements on images and on profiles can be made by accessing MANUAL MEASURES in the STUDIES menu.
- Use the SELECT PARAMETERS button to switch on/off the type of measurements displayed in the information table.
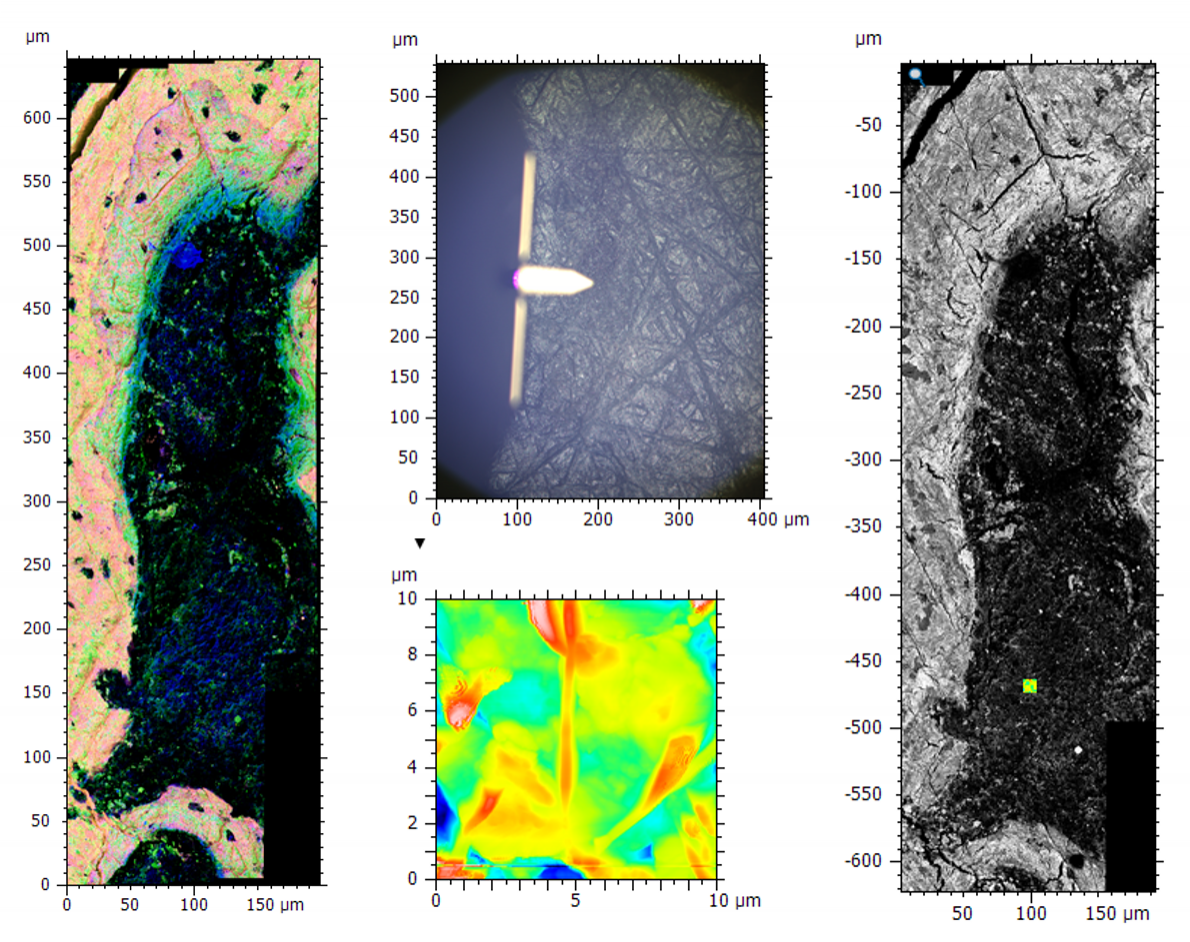
Image of bone tissue showing a large area montage EDS and BSE map (left), the optical image and AFM topography data (middle) and the correlated BSE and AFM data (right). The relative scales meant the optical image showing the AFM tip was required during correlation for the rough positing of AFM data before fine alignment with the higher resolution images.
Make things easy for yourself
Often when data is acquired on different microscopes it is at different magnification scales, which can provide a challenge for both the initial acquisition and the correlation of the data for analysis. The best way to deal with this situation is to take images at a range of magnifications making sure that there are common features visible in each magnification stage and some form of guide indicating where on the image the higher magnification data was acquired. In some cases, this may involve the use of optical images, as with the example shown above. AFM data acquisition was on a tiny area within the large EDS and backscattered electron (BSE) maps, making it very difficult to find the same region for correlation. During data acquisition we recorded the optical image from the AFM, showing the relative position of the tip. We could use this as a rough guide for initial placement of AFM data with fine adjustments made using BSE and EDS images.
Navigate and record processes via the workflow pane
These are just a few of the functions available in Relate to try and there are many more for you to discover. Everything you do in your Relate document is recorded in the workflow pane. This is a helpful tool to navigate within your document and provides a record of each process and new studiable, allowing you to revisit any step if required. It is also possible to set a Relate document up as a template and the workflow pane can be used to insert new studiables at the start.
Hopefully, these tips and tricks will help improve your correlative data analysis. If you are interested in learning more about these workflows as well as the steps involved in the acquisition of correlated data, please register for our next Relate tutorial to learn more.