Since Prehistoric times, people have been in contact with rocks and minerals, using them for tools, hunting and jewellery, and it seems that fascination has never ceased. Rocks are at the core of everything; they build up the planet, the Earth’s crust, and they have some of the same basic elements that also make up our bodies, like iron. Different rocks have different characteristics because of their minerals, the ways in which the rocks were formed and the processes that acted on the rocks since their formation.
So, no wonder, they are fascinating to study, but when we say analysis of geological sample, what does it actually mean? Obviously, you want to find more about your sample, so you are probably interested in phase associations, mineral texture, content, mineral distribution, particle size and perhaps many other characteristics.
One of the most common techniques used to study rocks and minerals is XRD, but this is more of the bulk technique which doesn’t provide any spatial information. With XRD, we can’t tell how the minerals are associated with each other, and we don’t get chemical information directly.
With optical microscopy techniques, we can differentiate individual mineral grains, but the spatial resolution is limited. This means we can’t analyse smaller grains when we are approaching the micron-range, and we can’t determine constituent elements or composition.
Historically, for this type of analysis, the go-to method was electron microscopy-based EDS - or WDS point analysis, for better spatial resolution but also limitations in the detectors speed. If we think how detector throughput has changed with time: around 2010, we could typically achieve a maximum count rate of around 120,000 cps, whereas now we can be closer to 1 million cps. With the introduction of SDD detectors, analysis of geological samples became much faster and EDS mapping (with collection of EDS spectra at each pixel) has become quicker. This means that now it was possible to gain good understanding of spatial distribution of minerals with this technique. With speed however, you can never have enough, so some geologists decided to go even further and to employ multiple EDS detectors to speed up their acquisition rates.
Probably, now you are asking yourself this question: could there be something else we can do to advance analysis of geological materials? Something even better?
Well, the answer is yes! We can always try to push things even further. So, what are some of the requirements we would have? I am sure you were thinking of speed and spectrum resolution, but I will add another one, and that is ease of use. What is often the problem is their contradicting nature. If we wish to quickly map the entirety of the sample, the amount of signal we can collect probably won’t be sufficient to reveal something we want to discover.
But that is changing now, thanks to our newest addition to Oxford Instruments family, the Unity BEX detector, the world’s first detector that combines Backscattered Electron and EDS (BEX) sensors.
Unity is coming to our rescue with that first performance hurdle - that of SPEED. Speed is important. We are all quite busy and even though we are willing to do more and more, time is slipping through our fingers. We cannot always spend ages being studious, and sometimes we just have to quickly get the things done.
Due to the unique placement of the Unity detector directly under the pole piece, signal throughput is exceptional, therefore propelling our analysis of large sample areas to new levels of speed. Just imagine having 20 Ultim Max 65 detectors on your SEM. This is comparable to one Unity detector, and that is the increase in throughput that you could expect!
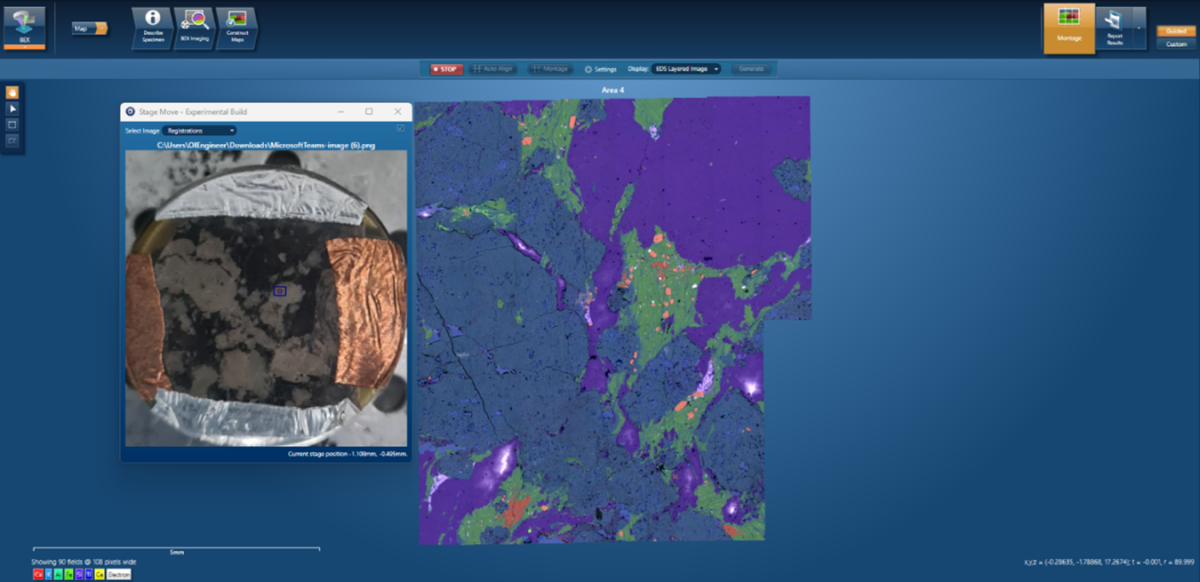
By way of example, I’ll take a sample of granite. In figure 1, a large portion of the granite sample is chosen by selecting a region on an optical image, using the easy grid tool, to collect what we are calling BEX Cartography. This brings me back to my second requirement, and that is the EASE OF USE. Anyone can set up the collection of large grid maps using Cartography navigator with just one click on your sample image, and all your settings will be transferred from the BEX Imaging Navigator. Then, just like that, almost like magic, your Large Area Map is acquiring! (Figure 1).
As well as the blindingly fast count rate, we are also saving some time by simultaneously collecting backscatter images and the X-ray data during the collection. This whole run took only 10 minutes. So, the new developed technology is allowing us to achieve the necessary SPEED with extraordinary EASE.
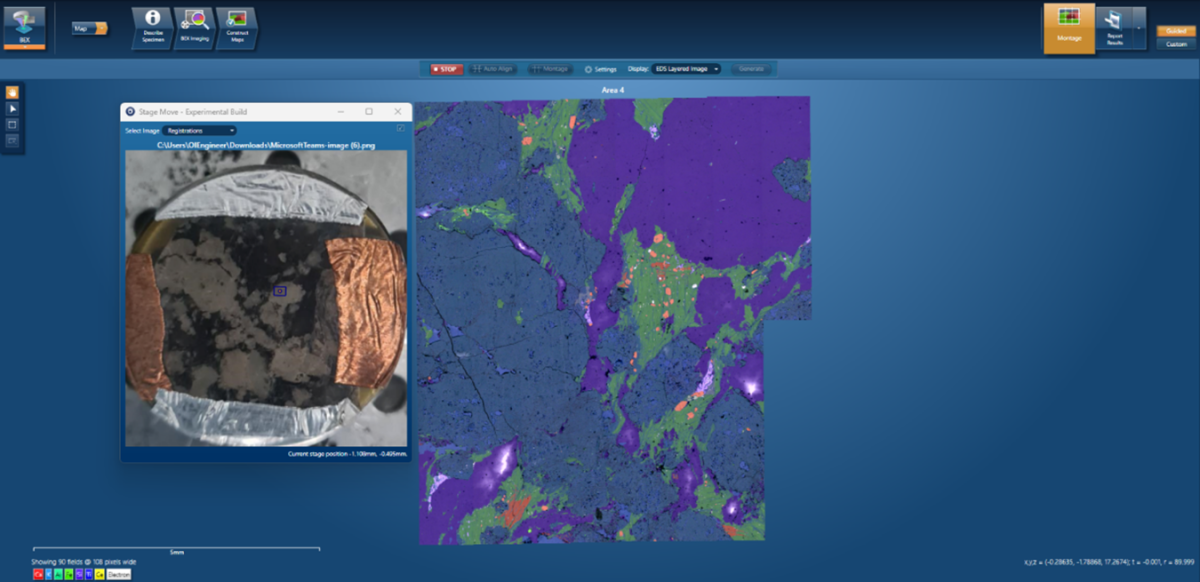
Figure 1: Cartography run on the granite sample. The left side shows the optical image of the sample used to define the area for cartography data collection.
Now, the real fun begins! From that rapid data collection, can we discover something important? I have included a Cerium map, because my plan is to see if I will be able to quickly locate monazite grains in the sample, our hidden gems. Monazite is a phosphate mineral that contains rare-earth elements and is an important ore for cerium, lanthanum, neodymium and thorium. Monazites are also interesting because their unique chemistry can be used for geochronological signature and pathfinder for magmatic evolution. Another interesting fact is that monazite is a potential host for nuclear byproducts of high-grade plutonium in decommissioned nuclear weapons and spent fuel from nuclear reactors.
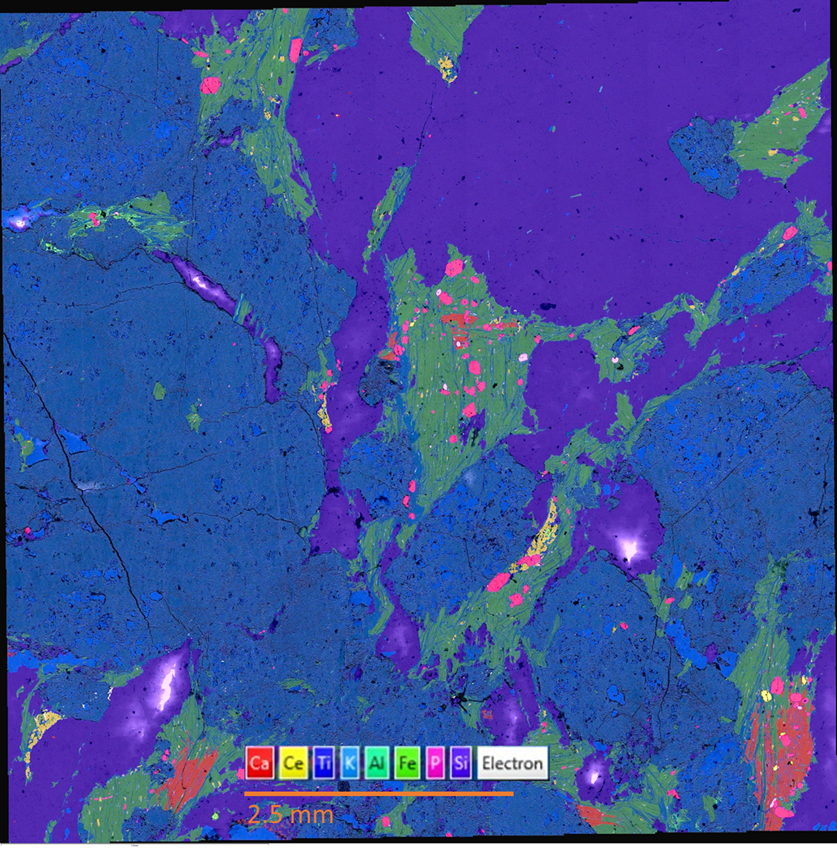
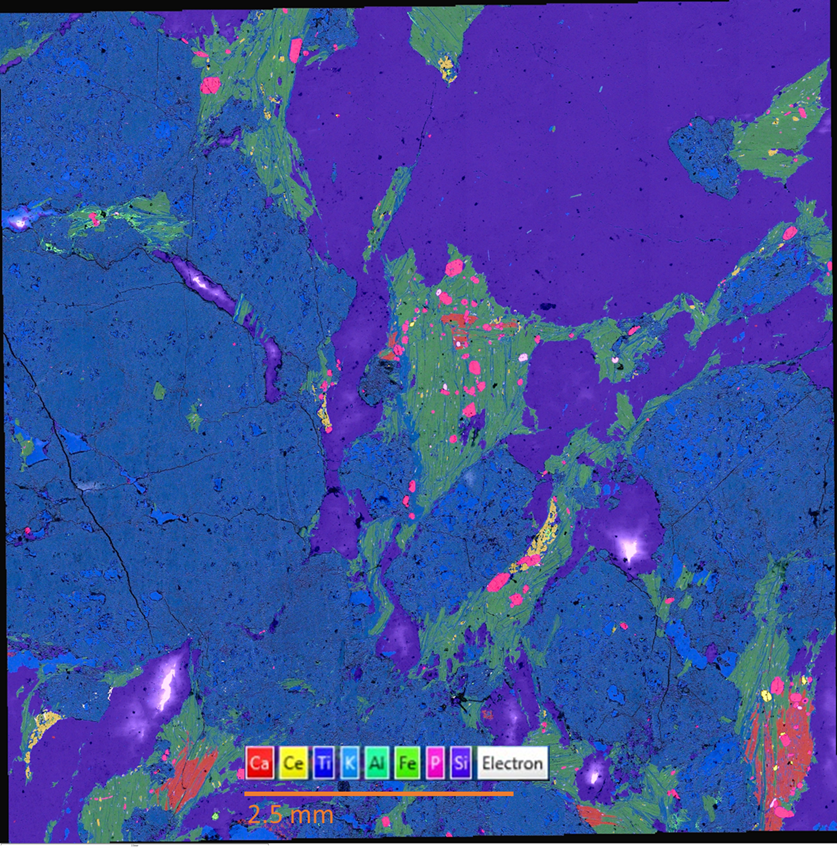
Figure 2: Montaged data 62 mm2, 4239x4266 pixels Unity BSE, EDS 2119x2133 pixel size 3.7 µm.
Having montaged the data, I can use this cartography map to easily relocate to a specific point on the sample. In the Cartography map (Figure 2), it is easy to spot the yellow grains representing our Ce-rich monazites, a couple of “gold nuggets”, so to speak.
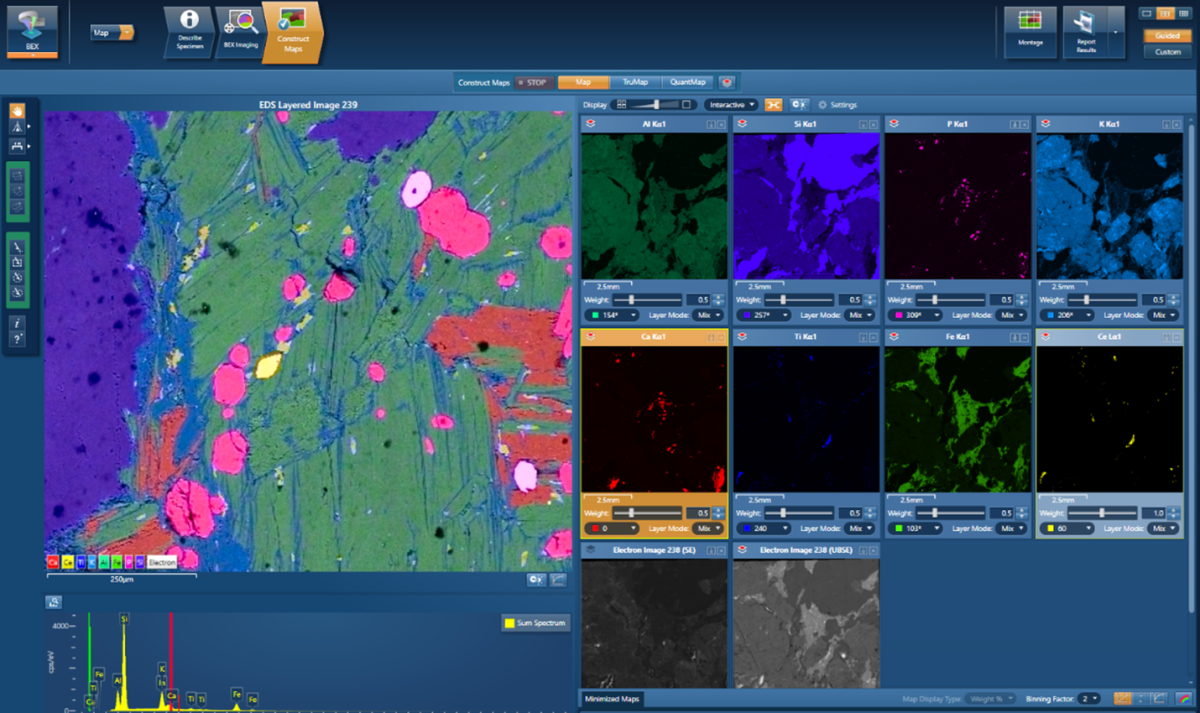
Figure 3 shows a zoomed in region of the map with the unique octahedral shape of potential monazite grains in yellow. Using the Unity BSE image, I can immediately see that there isn’t any visible zonation in the monazite. Monazite crystals often have multiple distinct zones that formed through successive geologic events that lead to monazite crystallization. These domains can be dated to gain insight into the geologic history of its host rock.

Figure 3: Zoomed in region of the Cartography run with potential monazite grain in yellow.
This will lead me to my last point, and that is spectral RESOLUTION. Our ultimate candidate for this task is, of course, our AZtecWave WDS system. If we need to be certain that the grain we have identified is truly monazite, and to fully understand its composition, we need some extra resolving power. Generally speaking, WDS offers better sensitivity and precision in quantitative analyses, and better resolution of overlapping X-ray peaks for improved element identification and quantification.
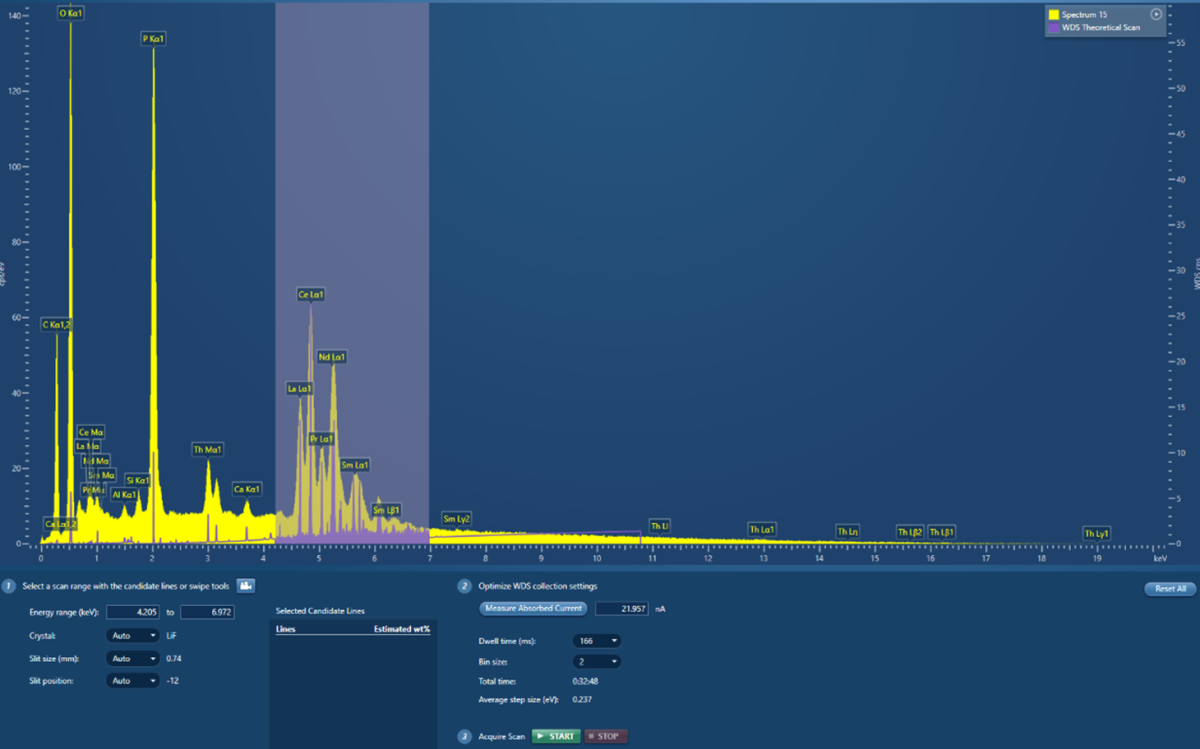
So full steam ahead, and let’s use our WDS system, which also gets some extra points again for EASE OF USE, because AZtecWave software has clear guidance on how to perform each task. In this case, I can quickly locate the identified grain with double click, open WDS scan and now magic can happen again. By selecting the region of the spectrum I want to scan, the system will measure the absorbed current and software will automatically decide for me (I just love this part) which diffracting crystals to use. And it will show me, in purple, a virtual WDS spectrum (Figure 4).
As simple as that, my questions are answered; what kind of resolution will I achieve; and which peaks I can resolve in the scan with my current settings? You may find it hard to fathom, but yes, that is how software works; I get an overview of what kind of results I can expect even before I start my analysis.
Amazing - no need to waste any precious time with trial and error. I can quickly decide that resolution is fine for what I want to achieve, and I am now willing to invest 30 minutes to see what type of monazite chemistry I have found. Let’s not forget that each monazite has a special REE fingerprint.
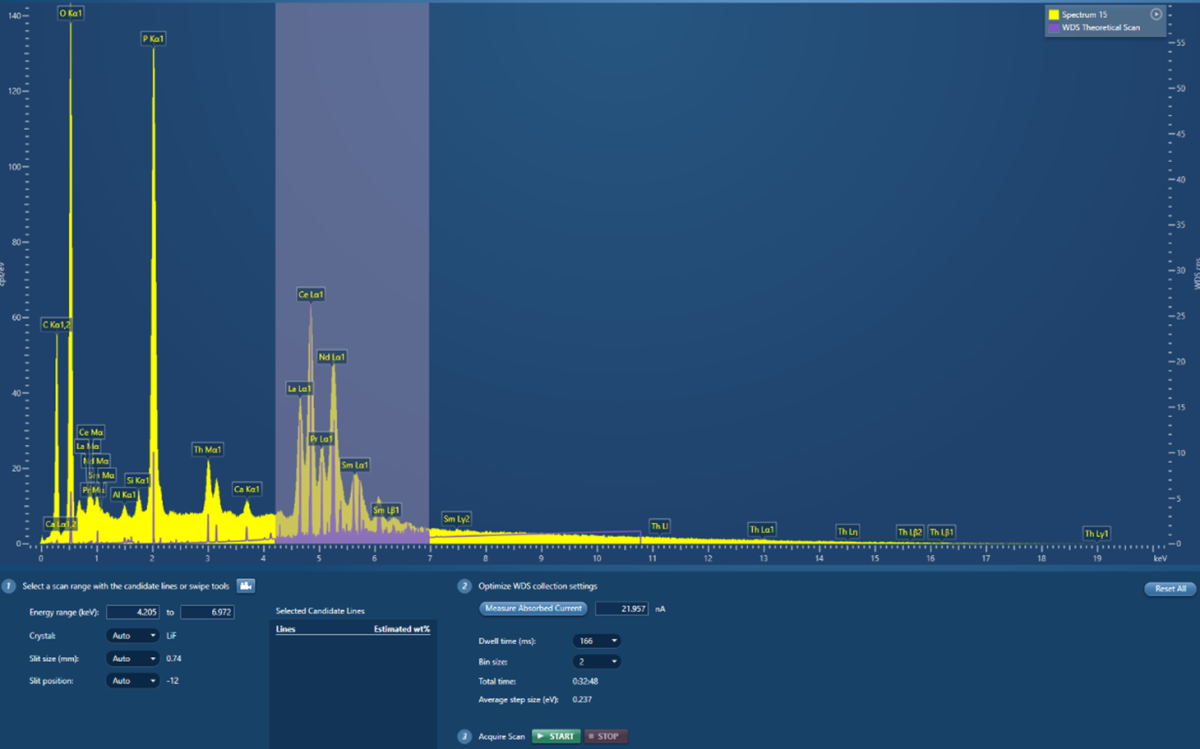
Figure 4: Setting up WDS scan on monazite grain, showing a virtual WDS spectrum in purple.
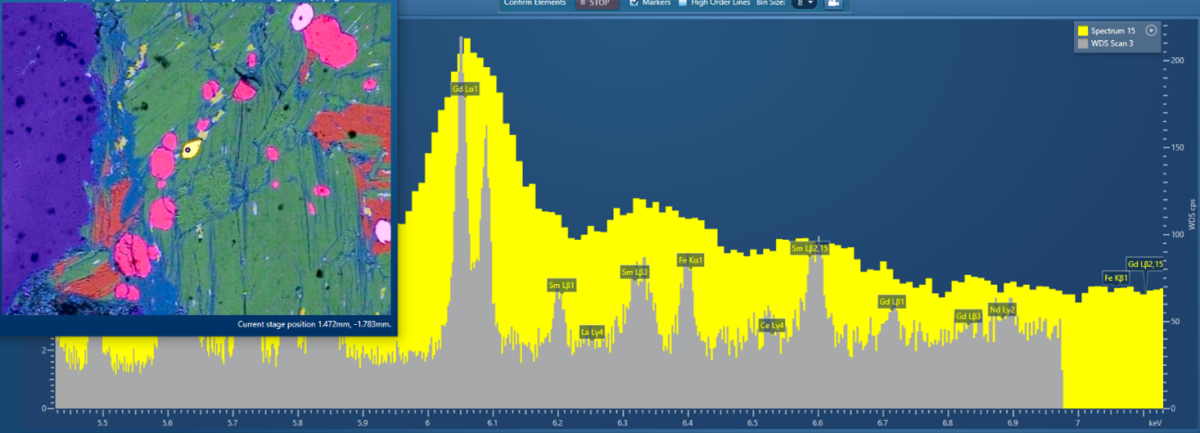
Voilà! After my tea break, I come back to the system, quickly glanced at my data, and I open my eyes in wonder. I can clearly resolve all these Rare Earth Elements; all the grey narrow WDS lines have emerged from the background (Figure 5).
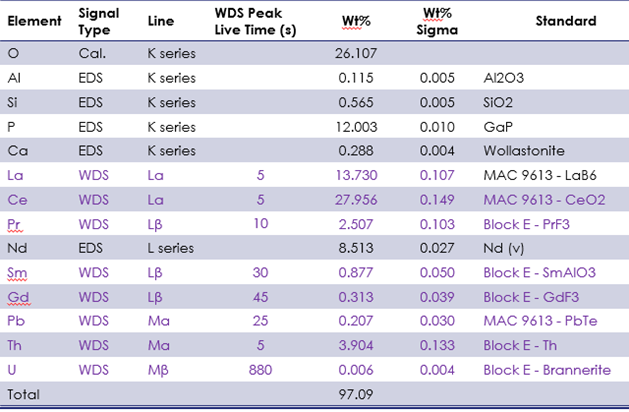
Isn’t it impressive how we can now clearly resolve everything that was hidden under the indistinct shapes of the EDS spectrum. Now, I also have proof that my sample contains monazite grains. What is also quite interesting is that we can see a strong gadolinium peak, which is not that common, and also a clear Samarium peak, another interesting finding. Now, I am able to continue with my tasks and perform quantitative analysis of monazite; and the results are listed in the table below. If you check the wt% sigma in the table, you will be able to tell how WDS can provide low levels of uncertainty.
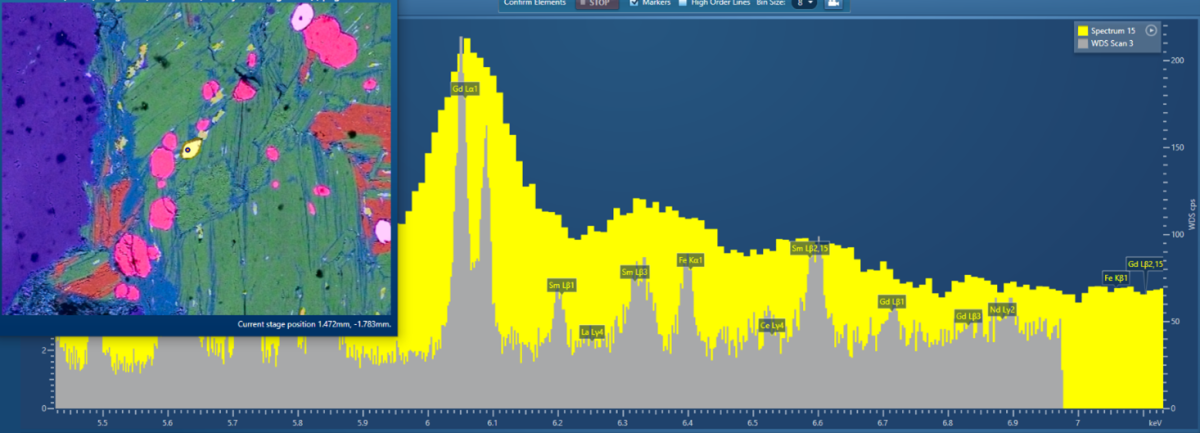
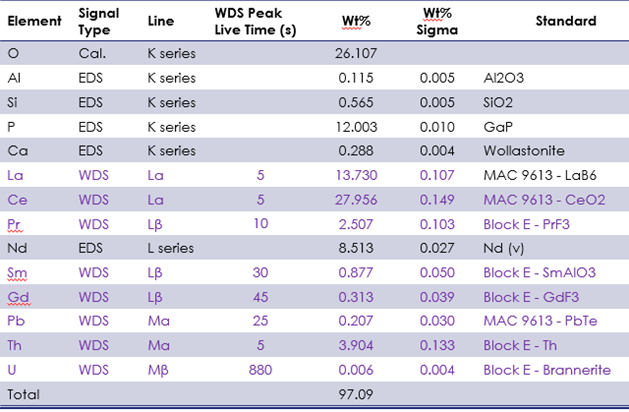
Figure 5: WDS scan showing multiple REE elements in monazite grain and the quantitative result (Unnormalized, O calculated by stoichiometry).
I hope that this blog has been a good illustration for you of how, with a BEX and a WDS detector, WE CAN HAVE IT ALL!
We can quickly analyse large geological samples, easily locate interesting grains and gain insight about their distribution. Effortlessly, you can collect a lot of useful information, even if, like me, you are not familiar with geology. Afterwards, we can shift into second gear, being our best resolution mode, and employ WDS to analyse some of the most challenging spectral overlaps, measure trace elements or just to perform the most precise and sensitive quantitative analysis. All your requirements for analysis of geological samples can be satisfied using this great detector combination! Technology is indeed changing the way we work for the better!
For more information about AZtecWave click here.


