Aim
Seafloor nodules, like many geological materials, are complex structures with features present at many different length scales. As such, to understand how they form and, therefore, where they may be found, it is necessary to understand both their macro and micro-structure – particularly the relationship between structures that may be visible optically or via electron imaging and composition. This requirement presents a challenge when analysing nodules (and a great many other geological materials), as it becomes necessary to image at a high magnification to understand the micro-structure, yet the whole sample needs to be imaged to understand the macro-structure.
Solution
When first putting a complex geological material into a scanning electron microscope (SEM), it is always useful to perform an initial reconnaissance of the sample so that an understanding can be developed of what elements are present within it and how they are distributed – for both major and minor elements. Unfortunately, this task is not always straightforward, as the different elements and minerals that are present may or may not appear different to each other when imaged in the SEM. Compositionally dissimilar phases may appear with the same grey level in a backscattered electron (BSE) image if they have similar overall mean atomic Z numbers. As such, one cannot rely on BSE imaging alone to differentiate between phases.
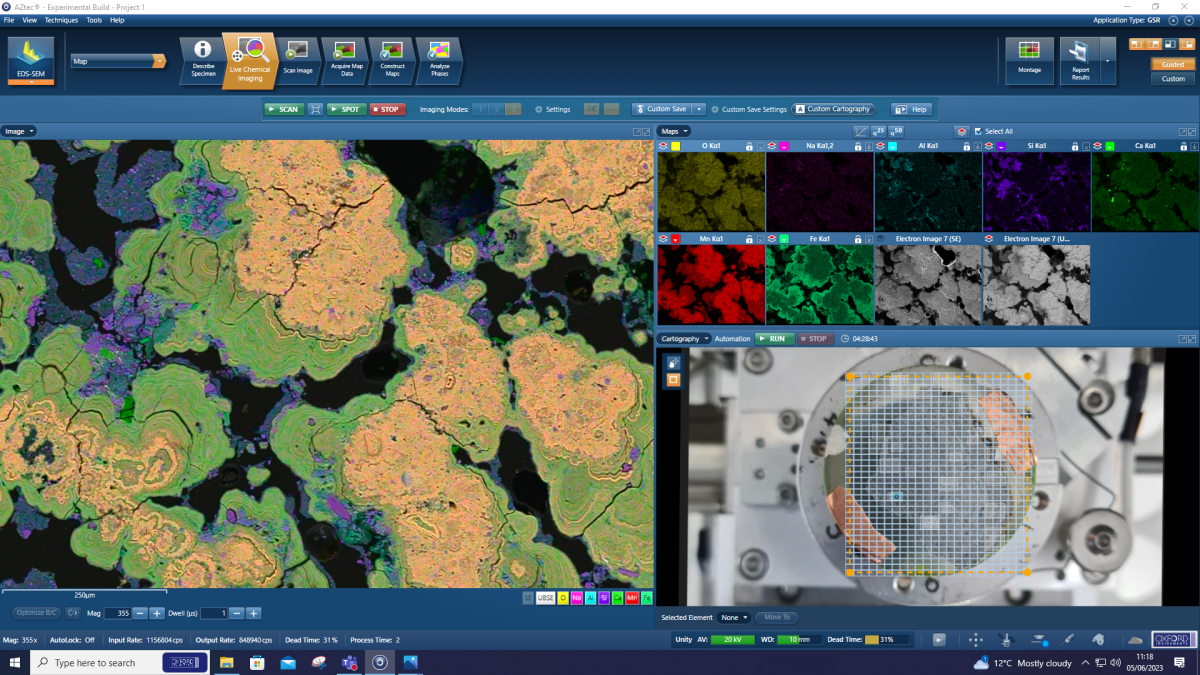
Figure 1; Identifying elements within the Mn-Nodule sample – Individual element maps are shown in the top right of the interface and a layered image of selected maps is shown on the left-hand side.
BEX imaging with Unity detector is the ideal solution for this task, as it acquires and displays both BSE and X-ray information simultaneously. As one moves around the sample, elements are identified and displayed as maps (Figure 1) in real time, making it possible to rapidly build up an understanding of what elements are in the sample and their distribution. This way of working can only be achieved due to the very high throughput achieved by Unity, which makes it possible for X-ray imaging to take place at the same time as BSE imaging.
Navigation is made particularly easy by interacting with a macro-scale (e.g. optical) registered image of the sample – perhaps taken with a smartphone. One can double click on features of interest in this image to navigate directly to them and relate what is seen on a micro or nano scale to the full-size sample. It’s also possible to keep track of exactly where on the sample has been visited – thus ensuring that key points are not missed, and bias is not introduced.
Once a basic understanding of the sample has been developed across a small area, one can then move on to a larger area analysis, so that the relationship between the macro and micro-structures can be understood. This transition can be performed particularly easily by making use of Unity’s cartography function.

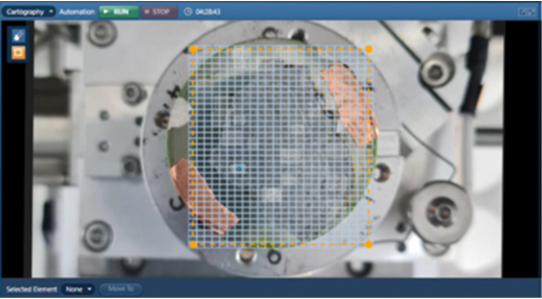
Figure 2: Setup of a large area BEX run across the entire sample using AZtecLive’s cartography functionality. The area was easily defined by dragging across the registered image.
A large area acquisition can be defined by simply dragging out an area over the registered image used for navigation (Figure 2). A large area BEX analysis, during which BSE and X-ray data are simultaneously acquired, then begins. There are 2 major advantages to performing this analysis with Unity. Firstly, Unity’s exceptionally high throughput means that far more X-ray data can be collected per second than would be possible with traditional methods – this means that far less time is needed to collect a certain amount of data per field of view and therefore overall throughput is far higher.
Secondly, a further time saving is achieved by acquiring BSE images and X-ray data simultaneously – as opposed to the traditional sequential approach. This means that the amount of time required to acquire the BSE image – typically of the order of a few seconds per field is saved. This may not seem much but given that large area map acquisitions can often be performed over thousands of fields, time savings in the order of hours for complete runs – just from this factor – are entirely possible. Overall workflow throughput can easily be improved by a factor of 10 or more.
Results
A high magnification large area map was acquired over the complete sample area. This consisted of 1288 fields at a magnification of 395x. This data was rapidly acquired in 3 hr 26 min and is shown in Figure 3.
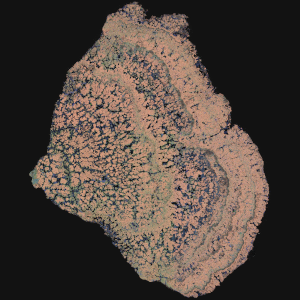
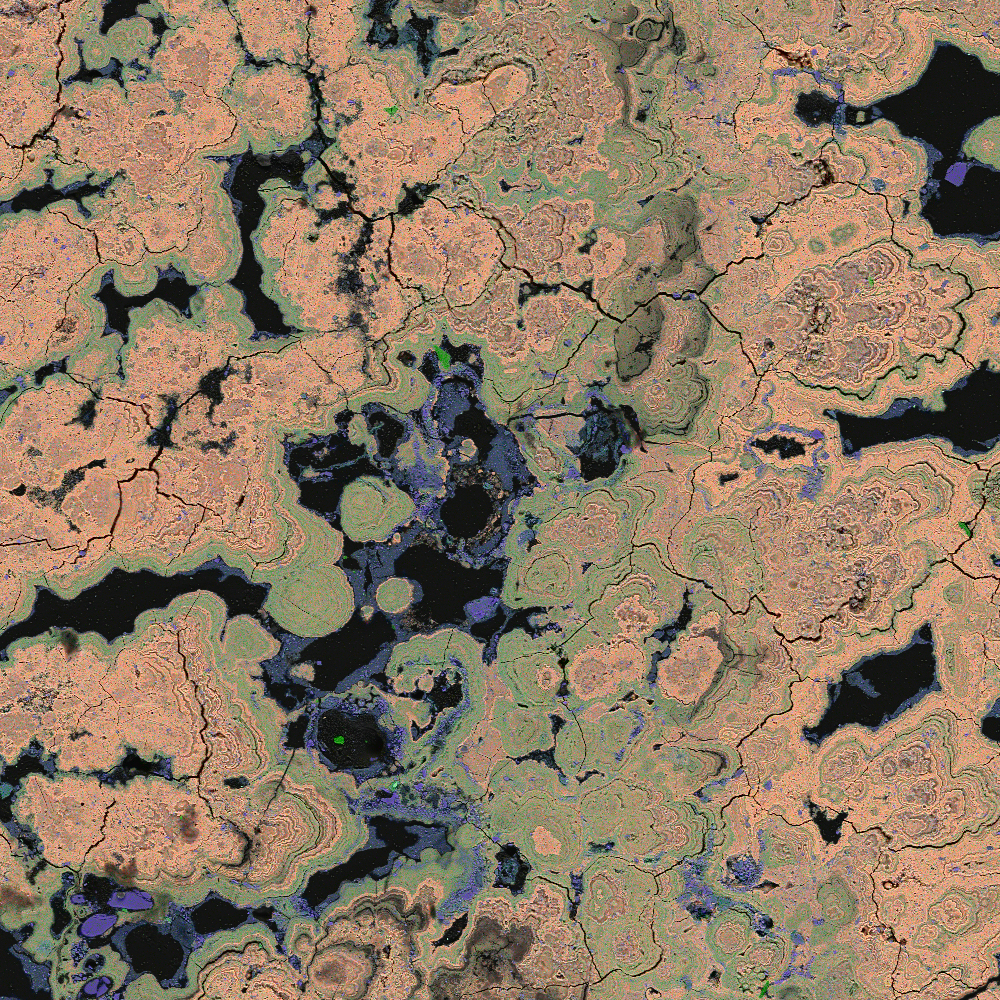
Large area BEX image covering 1288 fields of a Mn-Nodule. (A) shows the complete map of the whole sample and (B) shows the level of detail that the whole sample was mapped at. This map took only 3hr 26min to acquire at the level of detail.
Figure 3: Large area BEX image covering 1288 fields of a Mn-Nodule. (A) shows the complete map of the whole sample and (B) shows the level of detail that the whole sample was mapped at. This map took only 3hr 26min to acquire at the level of detail shown in (B).
The completed large area map shows both the macro and micro-structure of the nodule meaning that the processes that relate the two can be clearly visualised. Interestingly, the full resolution images show that in some cases, compositional variations match the structural variations seen in the BSE images whereas in others, the composition remains constant even though clear layering is seen in the BSE image.
Want to learn more?
If you’d like to learn more about the power of the new BEX technique in action, you can join me with my colleagues Haithem Mansour
and Lucia Spasevski
for our next webinar during which we will use a selection of different sample types to show what Unity can do for you.