I’ll begin this post by saying that there will be no more questionable alliterative wordplay, I promise! I will instead, provide an update on our exciting new addition to our analytic capabilities, and how we have recently used Raman and EDS in combination to solve one powdery conundrum for a client.
A Quick Update on our RISE-Gemini Demo Lab
Earlier in the year, I introduced our new Raman demonstration laboratory here at High Wycombe with the successful installation of our new Oxford Instruments WITec alpha300r Raman microscope. The exciting new development is the installation of our much-anticipated Zeiss Gemini460 SEM. Additionally, our RISE system was also installed and a special thanks to Dr Ute Schmidt for all her help!
Our Gemini460 now plays host to some of the very best that we have to offer from both NanoAnalysis and WITec, and we are all highly energised by it.
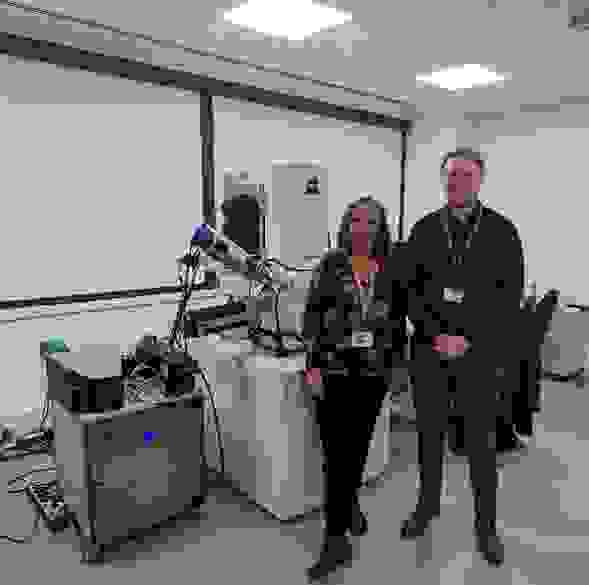
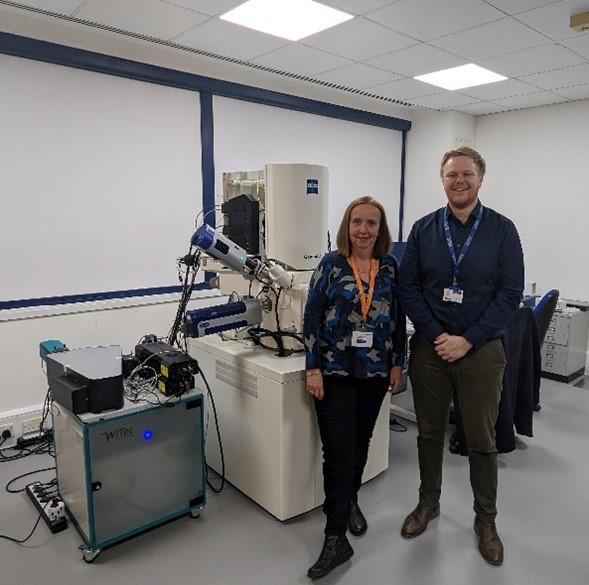
Dr Ute Schmidt (left) and Josh Lea (right) with our fully installed RISE-Gemini system here at Oxford Instruments High Wycombe.
Our Line-up
For EDS, we have our high-end Ultim Max and Extreme detectors, which give us unparalleled speed and resolution. These are installed alongside our all-encompassing Symmetry S3 detector for EBSD analysis and areall controlled, of course, by our world leading AZtec software. The final piece of the puzzle is our WITec RISE system, which delivers powerful, highly resolved confocal Raman imaging within our SEM chamber. So, at long last, we now have correlative elemental and molecular spectroscopic analysis at our fingertips. Look out for my next blog in which I will explore the real capabilities of this correlative analytical supergroup.
And now for something slightly different...
Before I embarked on my journey here at Oxford Instruments, combining EDS and Raman was an alien concept to me. However, when you think about it, they share significant similarities. Both techniques are heavily reliant on microscopy. The data we obtain is a direct result of the interaction between a beam and the sample, and the information we get helps us to characterise our material. Also, at an overly simplistic level, both techniques can generate some quite colourful pictures of our sample.
Now some of you may be wondering, why do I need both? Well, I hope this part of the blog will demonstrate what can be achieved when Raman and EDS are used cooperatively.
Our Challenge
Recently, a manufacturing company reached out to us with a problem. This problem was a turquoise contaminant powder that was wreaking havoc in a post-cleaning step causing significant disruption to the rest of their processes. To solve this problem, our client needed information on material composition and particle size distribution - and quickly.
Our Solution
Here is where our joint Raman and EDS solution came into its own. For those that may not be aware, EDS provides us with high-resolution compositional information, while Raman gives us the chemical “fingerprint”. We also have WITec’s intelligent TrueMatch and ParticleScout tools at our disposal. These give us the ability to match our spectra to existing databases and characterise the properties of each particle. If you are new to WITec and Raman spectroscopy, please see my previous blog for a brief introduction!
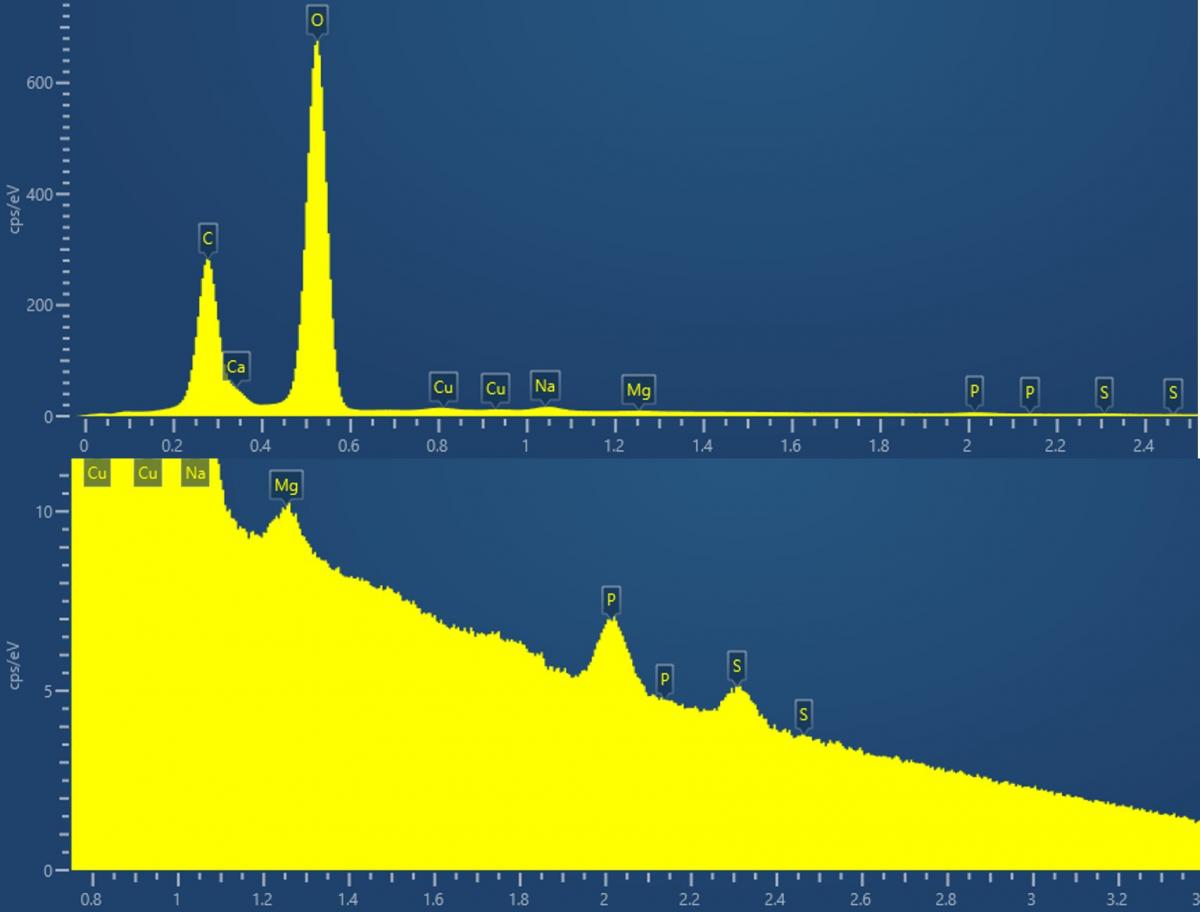
Now, back to the problem at hand, starting with the material composition. We were told that it was highly likely that the powder was simply limescale, but confirmation was needed. Fast EDS analysis, using our Ultim Max 100, showed several metal carbonates were present owing to the huge peaks from both carbon and oxygen along with calcium, sodium, and magnesium. It also answered the question regarding the turquoise colour, as contributions belonging to copper were present in the EDS spectrum. Notoriously, basic copper carbonate ( Cu2CO3(OH)2,
or malachite) is turquoise in colour. Unfortunately, however, more questions arose. We noticed that sulphur was also present, and we believed this meant something else was lurking within the powder.
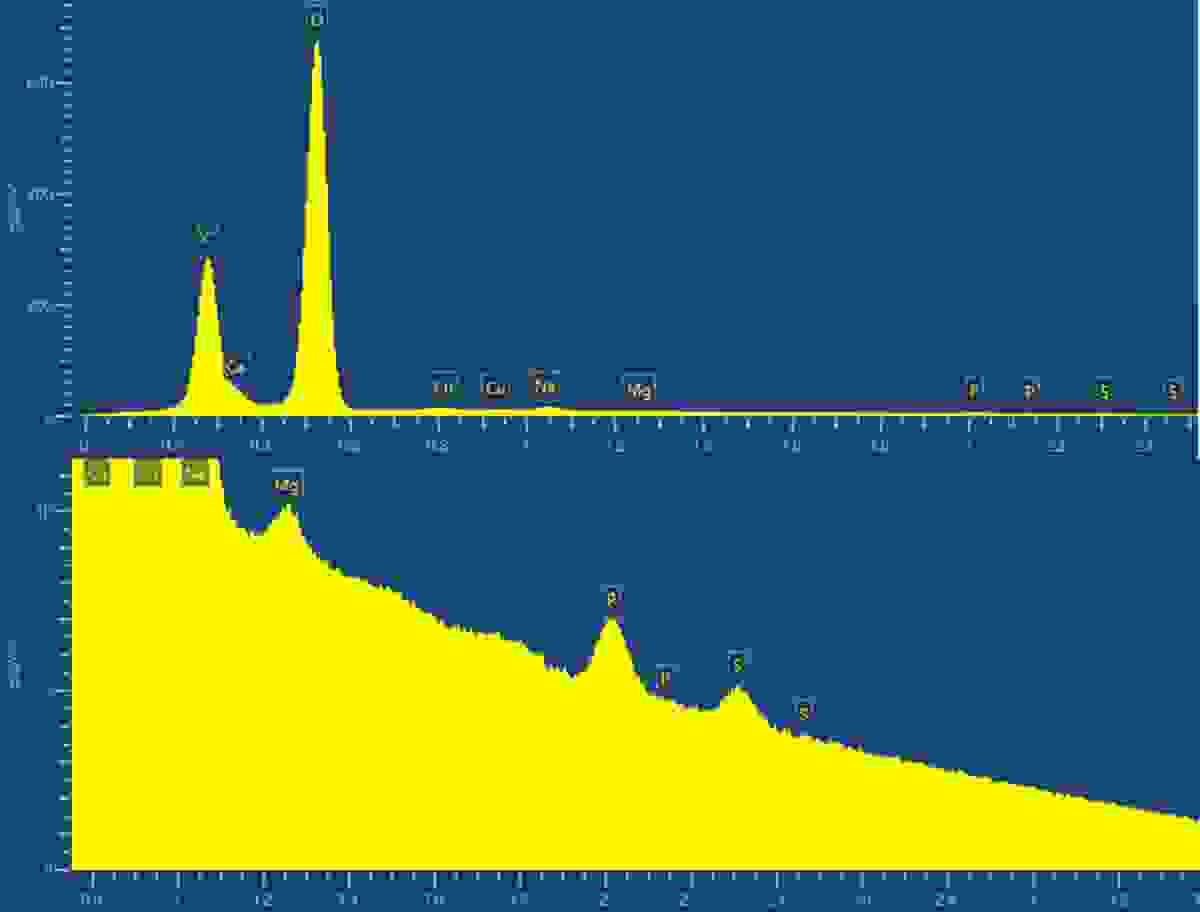
The EDS spectrum of the contaminant powder (top); and zoomed in view showing the presence of numerous metals and sulphur (bottom). Data was collected using an Ultim Max 100.
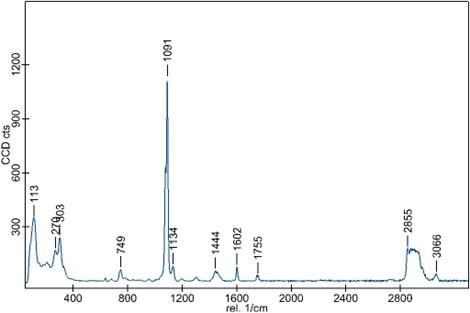
This is where the incorporation of Raman spectroscopy pays dividends. Raman analysis of the powder, using our WITec alpha300r, reaffirmed that carbonates were present. We know this, as the predominant components of the spectrum belong to CO3. It also confirmed our suspicions that something else was, indeed, hiding in the powder. We believed it was something organic, as the Raman peaks for our C–H bonds appear around 3000 cm-1. The next job was, therefore, to work out what this Raman spectrum belonged to.
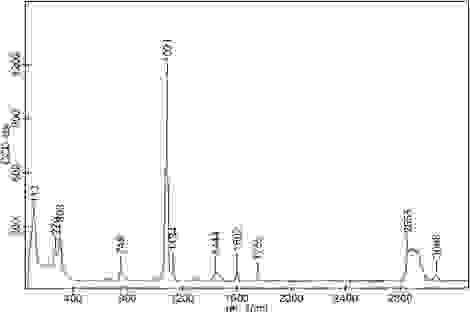
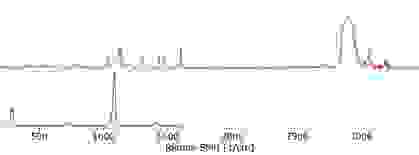
The Raman spectrum of the contaminant powder showing notable peaks at 749, 1091 and 1444 cm-1 attributed to carbonate. The presence of the organic material is confirmed by the peaks situated at 1134, 1602, 2855 and 3066 cm-1. Data was obtained using a WITec alpha300r, using a 532 nm laser.
The Identification
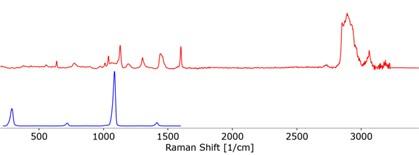
Usually, this would have meant identifying each individual peak and trying to figure out what vibration it represented. Luckily, WITec’s TrueMatch allowed us to rapidly screen our spectrum with a spectral database meaning we could quickly identify this mysterious component. The contaminant in question is most probably iminoctadine tris(albesilate) which is primarily used as a fungicide. We concluded that it is probably residue from earlier steps in the cleaning process.
The separated component spectra of the iminoctadine tris(albesilate) (top) and carbonate (bottom), identified using the WITec TrueMatch spectral database software.
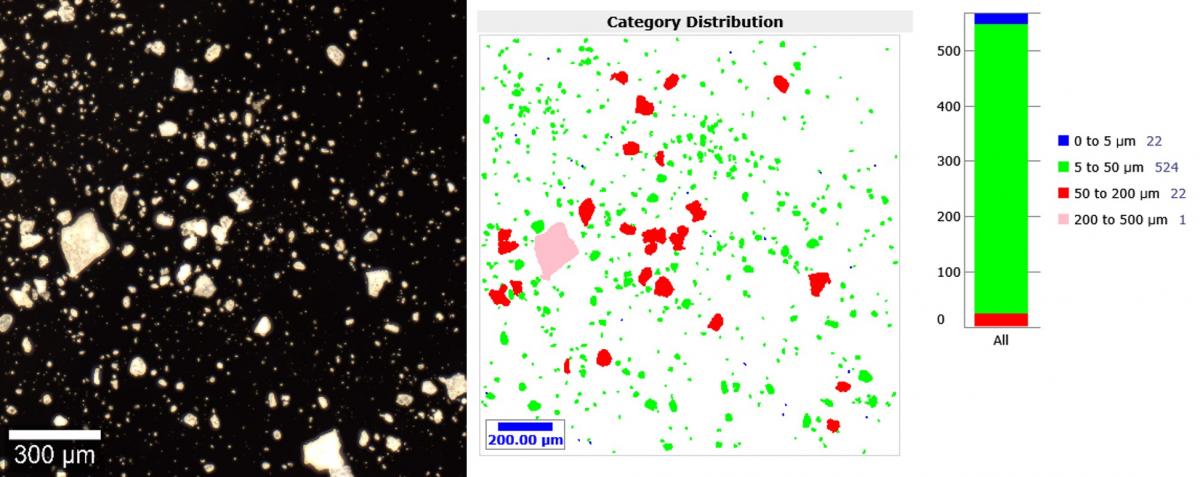
Turning our attention to particle size distribution, we had fast analysis capabilities of ParticleScout. Using our rather spectacular darkfield image, we could quickly identify and characterise the individual particles, showing us that most particles were sized between 5 and 50 µm.
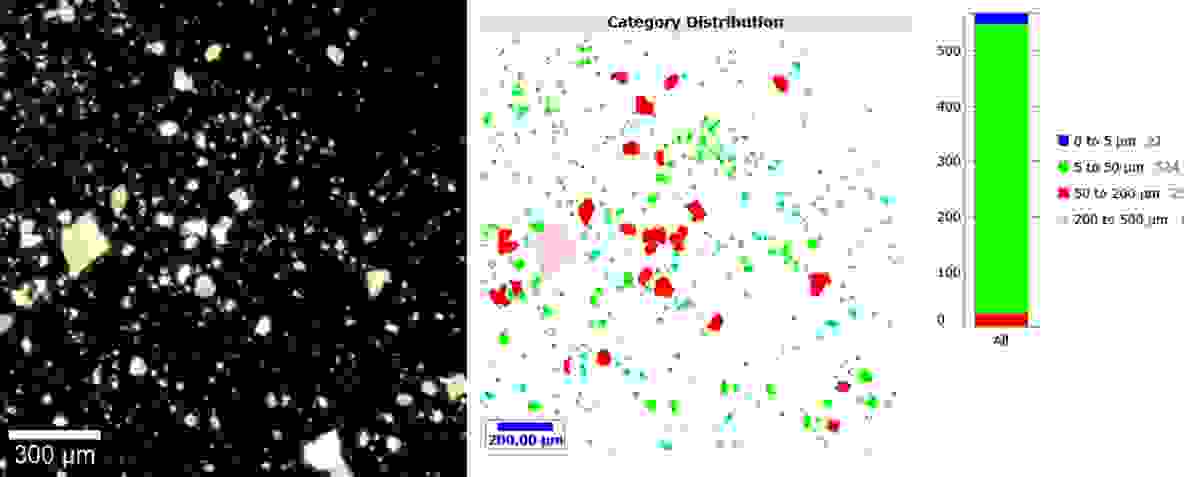
A darkfield image (left) and the corresponding report (right) of the contaminant powder, showing that the majority of particles were sized between 5 and 50 µm. The darkfield image was obtained using the WITec alpha300r using a Zeiss EC Epiplan HD 20x / 0.4 objective. The sizing report was obtained using the WITec ParticleScout analysis software.
The resolution
Our client was particularly grateful for the insight we were able to provide. It has allowed them to identify elements of their cleaning and filtration processes needed to be addressed to resolve the issue.
I greatly enjoyed the opportunity to flex my analytical muscles and to have the opportunity to experience the power of our NanoAnalysis and WITec products working in concert for the first time, here at Oxford Instruments.
Now, this project really only scratches at the very surface of what can be achieved with both Raman and EDS. That being said, I hope you see that using both techniques in tandem provides a powerful combination for chemical analysis.
Thank you for reading and please do look out for my next post, in which I will be getting grips with our RISE instrument and diving into correlative microscopy!