Part of the Oxford Instruments Group
Expand

Advanced SEM–EDS-BEX and Automated Mineralogy for the Characterisation and Processing of Rare Earth Element Resources

Rare Earth Elements (REEs) are critical to the performance of modern technologies, underpinning sectors from renewable energy generation and electric transport, to high-performance consumer electronics and defence systems. Global demand continues to rise sharply, driven by the accelerating transition to low-carbon technologies and the proliferation of devices requiring miniaturised, high-strength magnetic and optical materials. However, supply remains heavily constrained, with production concentrated in a small number of countries and vulnerable to geopolitical and economic pressures.

To unlock new deposits and optimise existing operations, geoscientists and process engineers must gain a detailed understanding of REE-bearing resources. This includes the accurate identification of REE mineral targets, quantification of their mineralogy, grain size and liberation characteristics, and determination of their association with gangue or other valuable phases. Such parameters govern both the feasibility of extraction and the efficiency of beneficiation, making advanced mineralogical characterisation essential to de-risking and improving REE supply chains.

An Advanced SEM-EDS Analytical Approach: An Overview

The complex mineralogy of REE deposits demands analytical workflows capable of resolving µ-scale compositional differences and delivering statistically robust data across large (m3-km3), heterogeneous volumes of rock. Scanning Electron Microscopy (SEM) combined with Energy Dispersive X-ray Spectroscopy (EDS) and Backscattered Electron and X-ray (BEX) detection offers a powerful solution. The proliferation of X-ray microanalysis has been due to its ease of use, flexibility to detect and quantify a wide range of elements on the nano to centimetre scale whilst operating at practical speeds for covering large samples and sample populations within the necessary time frames.

This study will cover two samples, focusing first on the identification and characterisation of sparse REE phases from a glacial till sample collected during regional geochemical exploration in Finland. Following this, mineral liberation characterisation is carried out on a particulated REE sample collected from an active mine site.

Using SEM–EDS Analysis to Detect Sparse REE Minerals in Large Samples

During early-stage exploration, REE-bearing phases are often difficult to identify and locate. They may occur at very low abundance, sometimes less than 1 wt.% of the sample, and are frequently present as microscale grains intergrown with other minerals. Their mineralogical diversity - ranging from bastnäsite and monazite to xenotime, allanite, and secondary phases in weathered material - further complicates detection. In soils and unconsolidated sediments, REEs may also be adsorbed onto clays and oxides, making visual identification via light microscopy impossible without compositional analysis.

To address this challenge, an Oxford Instruments Ultim Max Infinity large area SDD (170 mm2) EDS detector was used alongside the AZtecFeature automated particle analysis platform on a scanning electron microscope (SEM), enabling rapid and accurate screening of a glacial till for REE-bearing phases. AZtecFeature employed greyscale thresholds to separate particles within BSE images, specifically targeting bright detrital phases in this case. The software then automatically controlled the electron beam and EDS detectors to acquire compositional data from each feature. Operating at an accelerating voltage of 20 kV, a beam current of 5nA, and a working distance of 10 mm, the large-area EDS detector achieved exceptionally high-count rates, collecting spectra containing more than 20,000 counts in under 30 milliseconds. A total area of 4.62 cm² was analysed in 1.25 hours. This included 690 individual fields collected at 300x magnification montaged into a single high-resolution image (Fig. 1A). In total, 5,831 features were detected, and their morphology and chemistry were quantified during the automated run.

Figure 1 - Feature Analysis

Figure 1 – (A) large area bright phase analysis of a till sample performed using AZtecFeature. Colour scheme corresponds to AZtecGeo mineral classification, performed automatically during the automated analysis. (B) Inset map of mineral subclass filtered for REE bearing phases subclass. (C) Histogram displaying the equivalent circle diameter of REE-bearing phases.

A total of 131 REE-bearing mineral grains were identified within the till sample. Rare earth elements were automatically detected in the corresponding EDS spectra and quantified in real time using Oxford Instruments’ advanced spectrum processing engine, Tru-Q® IQ. By utilising the AZtecGeo mineral classification scheme, available as an add-on within AZtecFeature, the quantified EDS data were automatically classified into mineralogical categories, providing color-coded classification information within the montaged image (Fig. 1B). The identified mineral phases were predominantly monazite (80%), with a smaller proportion of allanite (20%). Closer inspection revealed that allanite commonly occurs within multiphase lithic fragments, whereas monazite is typically present as small, homogeneous grains with an equivalent circular diameter (ECD) of approximately 40 µm (Figs. 1B and 1C).

The combination of broad-area coverage, high count-rate acquisition, and reproducible automated data processing provides a practical and reliable approach for locating sparse REE-bearing phases, scalable across large sample populations. This workflow equips mineralogists with robust quantitative information on the abundance, spatial distribution, size, and mineralogy of REE-bearing phases within geological samples. Such data can inform mineral resource targeting studies, using suites of soil samples and their mineralogical signatures as vectoring tools. Furthermore, this reconnaissance-style analysis can guide subsequent, more detailed investigations through targeted point analyses and X-ray mapping.

Targeted X-ray Analysis and Mapping of REE Microstructure

Once sparse REE-bearing phases have been located, higher-resolution compositional characterisation may be required to confirm elemental content and assess zoning or intergrowth textures. In this study, this was achieved through targeted “Point & ID” quantification and high-resolution X-ray mapping using the Ultim Max Infinity 170 EDS detector and the Unity BEX detector, respectively.

Under the same beam conditions as the particle analysis, the EDS detector operated at an output count rate of approximately 500 kcps. Point analysis was performed on a single monazite grain from the till sample, acquiring a spectrum containing 100 million counts (Fig. 2) in less than two minutes of live time. Achieving such rapid, statistically robust quantification requires both high throughput and advanced pulse pile-up correction, which together ensure that large data volumes (millions of counts) are accurately placed within the spectrum. By accounting for the unique performance characteristics of the EDS detector, Oxford Instruments’ Tru-Q® IQ spectrum processing engine enables advanced pile-up correction and confident separation of overlapping peaks—a critical advantage in REE analysis, where spectra are often crowded with L- and M-lines from multiple elements (Fig. 2). The accuracy of REE peak deconvolution is illustrated in Figure 2 by the close agreement between the measured EDS spectrum (yellow bars) and the modelled spectrum (pink line).

For comparison, a spectrum totalling 26,000 counts was acquired under the same beam conditions, with a live time of just 0.03 seconds. Despite the significantly lower count statistics, the resulting quantification closely matched that of the 100 M-count datasets. Specifically, it detected low concentrations of Si, Ca, and Sm (0.1-1 wt.%) while maintaining the ability to resolve the same range of X-ray lines (Fig. 2), with the exception of minor Pb concentrations. This comparison demonstrates that extremely high-speed 26 K-count EDS spectra - comparable to those acquired during automated particle analysis - can reliably and repeatedly detect and quantify REEs in mineral phases with minimal user input.

Figure 2 - Spectrum

Figure 2 – Quantification of monazite using EDS ‘Point & ID’ with a spectrum containing 100 million counts vs a spectrum containing 26 thousand counts. Both spectra were acquired under the same analytical conditions for a live time of 113 seconds and 0.03 seconds, respectively. An extract from the 100 million count spectrum highlights the difficulty of REE quantification due to the closely spaced nature of X-ray peaks. BDL = below detection limit.

For microstructural examination, the addition of the Unity BEX detector enables simultaneous acquisition of Z-contrast images and high-speed X-ray maps. This integrated approach captures both the distribution of major and minor elements and associated textural information within a single, pixel-by-pixel correlated dataset (Fig. 3A).

Figure 3 - X-ray Map

Figure 3 – (A) Layered backscattered electron and X-ray image of particulated REE ore particle. (B) Ca X-ray intensity map. All data collected using Unity BEX detector and processed using TruMap. Complex intergrowth of Silicates, calcium carbonates and (Ca, REE)-fluorocarbonate REE-bearing. Significantly, REE phases synchysite (Syn.), parisite (Par.), and fine needles trending towards Bastnäsite (Bas.) composition can be denoted by varying Ca content.

In a single 60-second acquisition, the BEX image resolves sub-micron features of the REE-bearing particle, revealing associations with silicate–carbonate gangue phases as well as the complex intergrowth of several (Ca, REE)-fluorocarbonates. These (Ca, REE)-fluorocarbonates can be distinguished by their relative calcium concentrations (Fig. 3B), which range from 13.2 wt.% in synchysite to 8.3 wt.% in parisite and 0.7 wt.% in near-bastnäsite composition sub-micron needles. Notably, REE deportment varies by up to 30% between these phases. The presence of these three phases has implications for beneficiation, as increasing calcium content reduces the susceptibility of REE minerals to magnetic separation.

Close inspection of unprocessed REE X-ray maps (Fig. 4) highlights the importance of accurate spectrum processing during high-speed mapping, as misleading spectral artefacts can result in false representations of REE distribution. In Figure 4A, sulphur Kα pulse pile-up is incorrectly displayed as La Kα, creating an apparent increase in REE-bearing phases. Similarly, in Figure 4B, Ti Kα and La Lα peaks are not effectively deconvolved in the unprocessed map, falsely indicating the presence of La in Ti-rich phases. Once pile-up correction and peak deconvolution are applied using QuantMap (Fig. 4C) and TruMap (Fig. 4D), respectively, the qualitative distribution of La is corrected.

Figure 4 - REE X-ray Maps

Figure 4 - (A) Unprocessed La Lα intensity map of REE bearing minerals in particulated REE ore. (B) Unprocessed La Lα and Ti Kα intensity map of allanite bearing till particle. These images highlight the importance of spectrum processing using (C) QuantMap and (D) TruMap when mapping La distribution in the presence of S and Ti.

Together, Unity, Ultim Max Infinity, and Tru-Q® IQ provide a complementary toolkit that bridges high-throughput reconnaissance and detailed mineralogical characterisation, ensuring a comprehensive assessment of chemistry, mineralogy, and microstructure.

Using AZtecMineral to Perform Mineral Liberation Analysis of REE-bearing Minerals Ore Samples

Specialised automated mineralogy software, AZtecMineral, was utilised to carry out Mineral Liberation Analysis (MLA) on REE feedstock. Unlike the general particle analysis platform AZtecFeature, AZtecMineral includes additional quantitative framework pertinent to MLA. By integrating compositional and textural data, AZtecMineral enables the generation of:

  • liberation curves
  • recovery curves
  • particle (phase) association data
  • mineral and element abundance
  • grade–recovery relationships
  • particle size distributions

AZtecMineral performs MLA by automating BSE imaging, which delivers greyscale contrast for phase differentiation. Manual greyscale thresholding and segmentation algorithms are used to delineate individual particles and grains within them. The system then automatically controls the electron beam and EDS detector to acquire a single spectrum from each grain.

MLA was conducted on a single mounted and polished sample of REE feedstock. In this example, the same EDS hardware (Ultim Max Infinity 170) was employed under consistent beam conditions (20 kV, 5 nA) for high-speed analysis at approximately 500 kcps. Across the analysed area (Fig. 5), 78,593 particles were measured. Each particle’s spectrum contained approximately 20,000 counts, all processed automatically using the Tru-Q® IQ spectrum processing engine.

Figure 5 - Large area REE feedstock
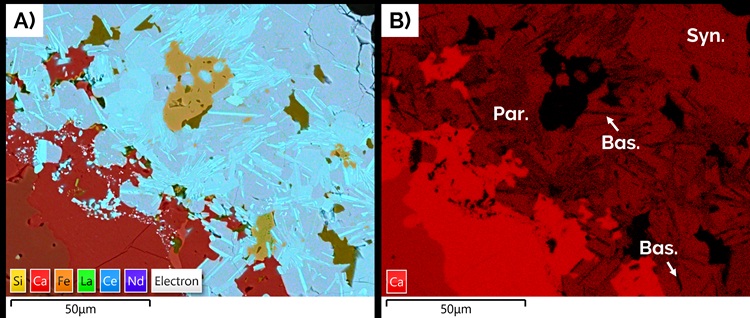
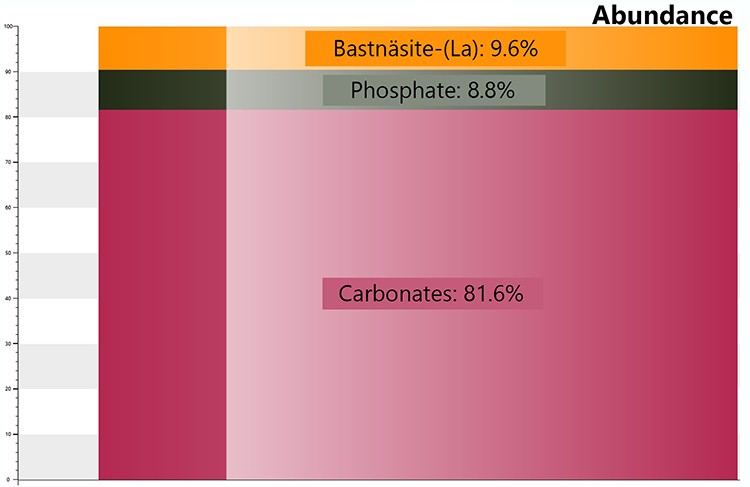
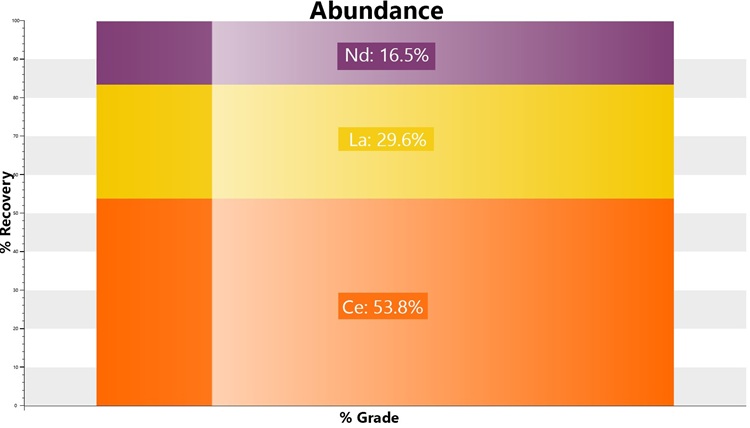
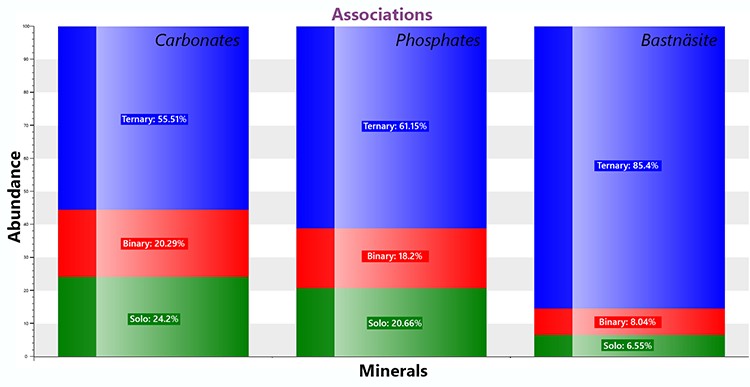
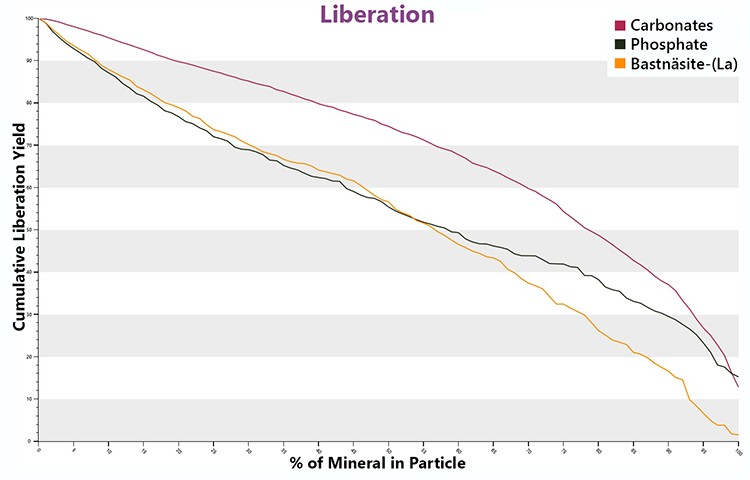
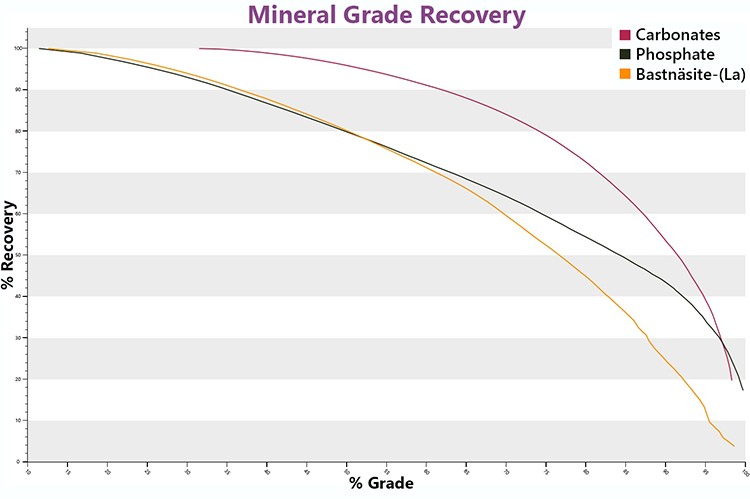
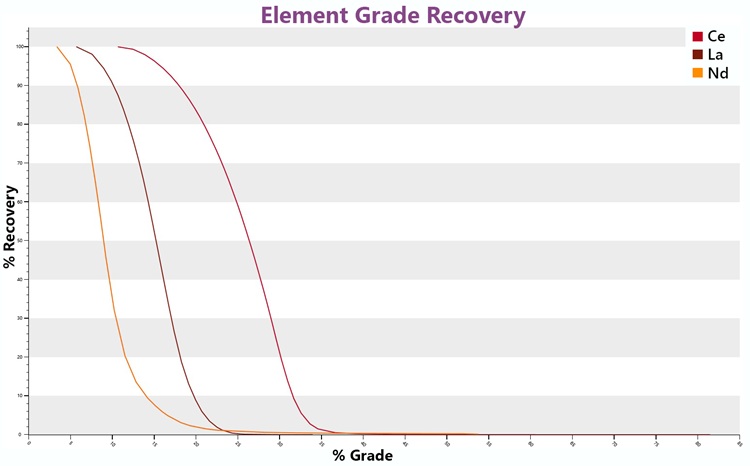
Figure 5 - Large area feature analysis of mounted REE feedstock in 32 mm epoxy stub.

Using GrainAlyzer 2 (GA2), data from AZtecMineral were organised into mineral classes based on the inbuilt library which includes nearly 5,000 mineral phases. Once classified, the MLA data were automatically presented in a range of standardised formats (Figs. 6–11), enabling consistent reporting and streamlined interpretation of results.

Figure 6 - Mineral Group Abundance

Figure 6 - Mineral Group Abundance describing the proportion of the phases in the REE feedstock sample.

Figure 7 - Element Abundance

Figure 7- Bulk sample REE abundance (Ce, La, and Nd.).

Elemental deportment data revealed that REEs are distributed across several mineral hosts, notably the carbonate phase bastnäsite, guiding decisions on which phases to target for optimal recovery. Importantly, the REEs are not present in equal abundance, with cerium (Ce) accounting for over 50% of the total REE content in the ore (Fig. 7).

Figure 8 - Phase Association Analysis

Figure 8 - Particle association analysis of bastnäsite-bearing particles. The chart displays the number of mineral phases found in contact with bastnäsite particles within the REE feedstock. 

Phase association analysis (Figs. 8 and 9) identifies both the number of mineral classes and the types of minerals in contact with bastnäsite. This information is crucial for processing engineers, as associations with specific gangue phases (e.g., silicates or carbonates) can influence reagent selection, flotation behaviour, and overall recovery. Understanding that bastnäsite is predominantly in contact with two or more mineral phases helps anticipate potential challenges in separation and refining.

Figure 9 - Liberation Curves

Figure 9 - Liberation analysis of bastnäsite-(La), carbonate, and phosphate phases, showing bastnäsite-(La) is less liberated than carbonate and phosphate phases.

Liberation curves (Fig. 9) further quantify the proportion of bastnäsite liberated from gangue phases such as carbonates. In this case, the liberation curve for the carbonate gangue drops more rapidly, indicating that bastnäsite is less well liberated. These data are essential for optimising comminution strategies, as they inform the degree of grinding required to achieve sufficient liberation for downstream separation.

Figure 10 - Recovery Curves

Figure 10 - Grade–recovery curve for bastnäsite. The plot shows theoretical recovery across varying concentrate grades, supporting optimisation of feed grade and separation efficiency.

Recovery curves (Fig. 10) complement liberation data by predicting the theoretical recovery of bastnäsite at varying feedstock grades, helping to determine the optimal feed grade for the processing plant. Directly from GA2 output, the best compromise is approximately 70% recovery from a feed grade of 60% bastnäsite. Element grade–recovery curves go further by illustrating the relationship between the concentrate grade of a target element and its corresponding recovery. Notably, REEs exhibit contrasting recovery behaviours, with neodymium (Nd) achieving 100% recovery at a grade of less than 10%. This insight is particularly valuable, as Nd is more than 20 times the value of Ce and La.

Figure 11 - Element Grade Recovery Curves

Figure 11 - Element grade–recovery curves for Ce, La, and Nd. Neodymium exhibits high recovery at low grades, while Ce and La show more gradual declines, highlighting differences in separation efficiency and economic value.

By combining the precision of the Ultim Max Infinity EDS with AZtecMineral’s dedicated automated mineralogy platform, we rapidly acquired large volumes of reliable morphological and compositional data. GrainAlyzer 2 streamlined classification and presentation, transforming complex, unclassified datasets into actionable MLA insights—delivering accurate results, faster, to support confident process optimisation.

Summary

Oxford Instruments’ SEM–EDS–BEX and automated mineralogy solutions deliver rapid, reliable characterisation of REE-bearing materials. High-throughput Ultim Max Infinity and Unity detectors, combined with advanced Tru-Q® IQ spectrum processing and AZtecFeature software, enabled autonomous location, detailed quantification, and rapid microstructural imaging of REE-bearing phases within a regional geochemical survey sample. Expanding this workflow to mineral liberation analysis with AZtecMineral and GrainAlyzer 2, we achieved real-time quantification and actionable processing insights for a carbonate-hosted REE ore. Together, these capabilities equip geoscientists and process engineers with the confidence to make informed decisions on resource targeting, evaluation, and process optimisation.


Date: October 2025

Author: George Stonadge & Alexandra Stavropoulou

Category: Application Note

Download as pdf

Share

Related assets