The collection of the diffraction pattern from the sample is a critical step in the Electron Backscatter Diffraction (EBSD) workflow, but equally important is the process by which that pattern is converted into useful information (indexing) – namely confirmation of the phase, the 3D orientation of the crystal lattice or subtle changes in the unit cell relative to a reference standard.
The requirements from an indexing engine are very dependent on the application in question, and EBSP (pattern) resolution affects the accuracy of the orientation measurement and influences the analysis speed and data quality [1,2]. For example, for high-speed mapping the focus will be on the indexing of relatively low resolution (and potentially noisy) EBSD patterns acquired in only a few 100 μs or less, whereas for measuring elastic strain, high quality EBSD patterns may need to be compared rigorously to an undistorted reference pattern, with little or no emphasis on speed (Figure 1a, b).
The latest CMOS-based EBSD detectors, such as Oxford Instruments’ Symmetry S3 detector, can collect Mega Pixel resolution patterns; however, this is not appropriate for some common experiments for a number of reasons since higher resolution images 1; take longer to transfer from the detector to the acquisition software and 2; take longer to process (e.g. for background correction and Kikuchi band detection). High resolution may also provide little benefit if the high resolution EBSP is being processed using a much lower resolution Hough transform to detect the band positions.
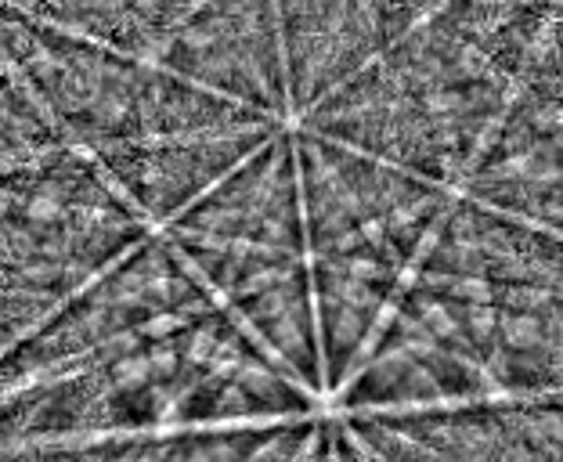
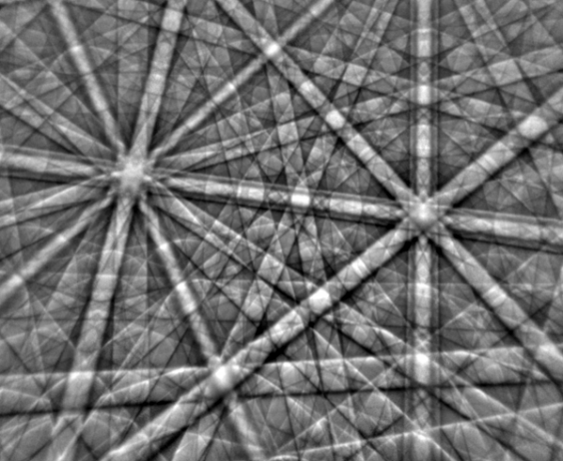
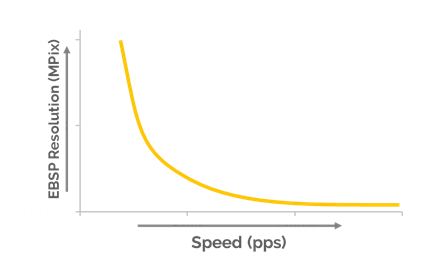
Figure 1, a) Low resolution EBSP (156 x 128 pixels) from a ferritic steel sample b) High resolution (Symmetry 1244 x 1024 pixels) EBSP from a Zirconium Oxide sample and c) EBSP resolution vs acquisition speed (pps)
Figure 1 shows that there is a general trade-off between EBSD pattern resolution and acquisition speed, and temptation is to lower the EBSP resolution so that patterns may be collected, transferred and processed much more quickly. However, decreasing EBSD pattern resolution also leads to inferior angular resolution and decreased sensitivity for strain analysis and dislocation density (GND) measurements, as shown in Figure 2.
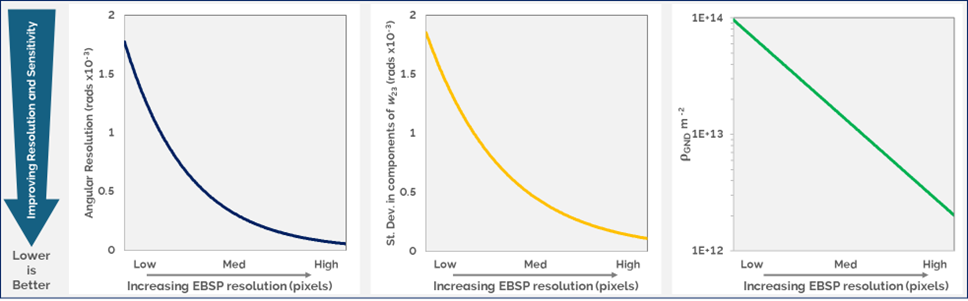
Figure 2 – EBSP resolution plotted against a) angular resolution, b) Std.Dev. of rotation and elastic strain components and c) GND sensitivity. Trends extrapolated from Jiang et al 2013 [3].
The decrease in angular resolution also impacts other measurements such as:
- Pseudo-symmetry orientations
- Phase ID and discrimination of crystallographically similar phases
- Mapping of deformation, such as KAM, GND and Strain Analysis
Challenge
The challenge for users is to optimize the balance between the EBSP resolution required to complete the tasks at hand and the speed and efficiency at which the data can be acquired, transferred and processed.
Experimental Procedure
This note uses three EBSP resolutions to investigate the point at which the investigations listed above would become difficult, Table 1. Three use cases comparing a Medium and a Low resolution data set with an artificially binned Ultra-Low resolution EBSP data set are shown.
| |
Med |
Low |
Ultra Low* |
| EBSP Resolution X,Y |
320 x 240 |
156 x 128 |
110x91 |
| EBSD Total Pixels |
~77k |
~20k |
~10k |
Table 1. List of investigated EBSP resolutions vs artificially binned ultra-low resolution.
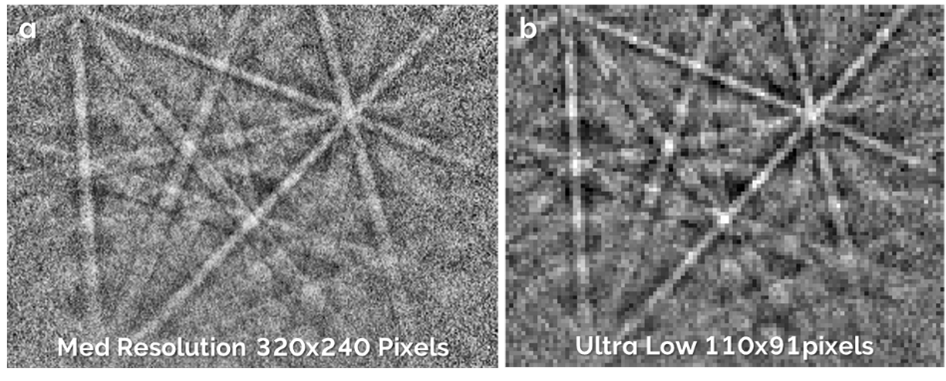
Figure 3 – Example of a) Medium resolution 320 x 240 (77K pixels) and b) artificially binned to Ultra Low resolution 110 x 91 (10K pixels) of stored TiAl EBSPs.
The artificially binned Ultra-Low data sets were re-indexed using AZtecHKL indexing, Hough 50 and optimized band detection using 11 bands. Phase maps, KAM maps and IPF maps were plotted using AZtecCrystal.
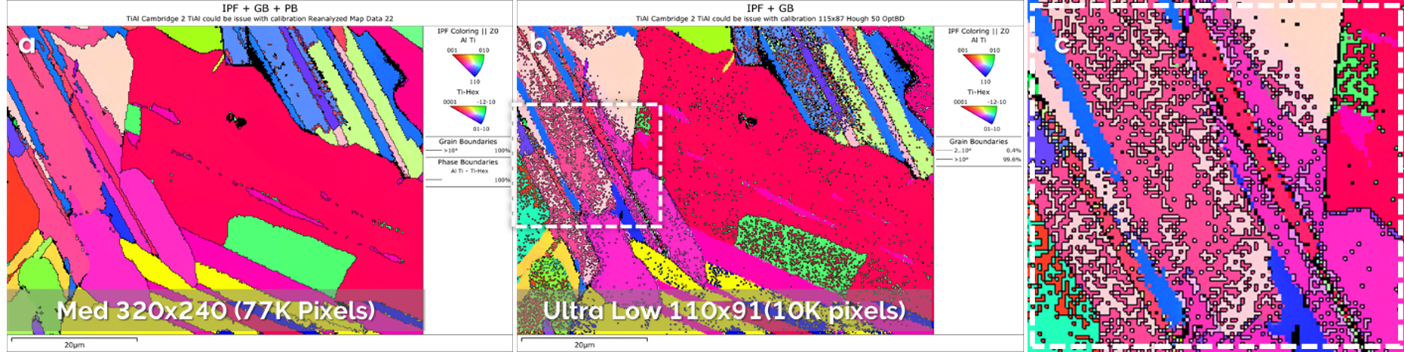
Figure 4. IPF//Z maps of TiAl alloys from a) original stored patterns Medium Resolution 320 x 240 (77K pixels) compared to b) Ultra-Low resolution 110 x 91 (10K pixels) and c) in-laid area showing persistent pseudo-symmetry issues with Ultra-Low resolution EBSPs (10K pixels).
Figure 4 demonstrates the need to maintain a relatively high EBSP pixel resolution to be able to correct for the pseudo-symmetry problems that occur in this TiAl alloy. Fig. 4c, shows the systematic mis-indexing caused by the decreased angular resolution from the Ultra-Low resolution 110 x 91 (10K pixels) EBSPs compared to the fully resolved and correctly indexed measurement in Figure 4a.
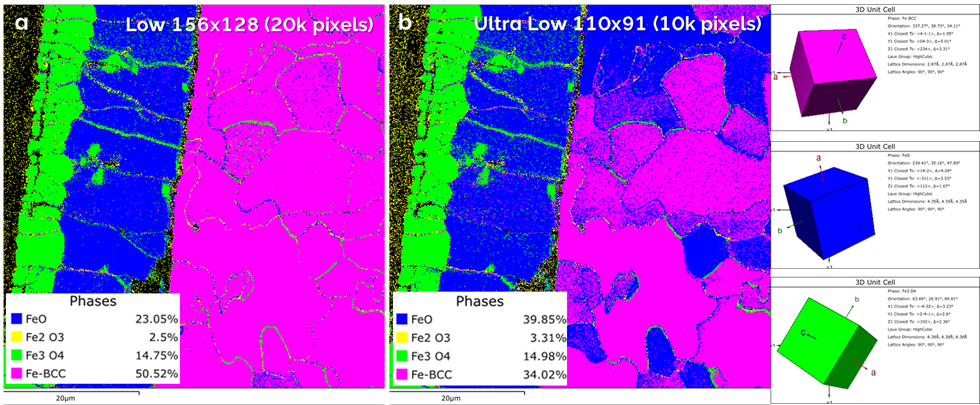
Figure 5. Steel Oxide phase maps of a) Low 156 x 128 (20k pixels) and b) Ultra Low 110 x 90 (10k pixels) showing poor phase discrimination at Ultra-Low EBSP resolution leading to incorrect phase proportions.
Figure 5 shows that the decrease in angular resolution from Low EBSP resolution 156 x 128 (20K pixels) to Ultra-Low EBSP resolution 119 x 91 (10k pixels) is enough to cause major issues when differentiating between the three similar cubic phases found in this steel sample. The key issue is that 10k pixels is not enough to correctly define the cubic Iron Oxide (FeO, blue) phase compared to the similar Iron (Fe-BCC, pink) substrate, Figure 5b. This results in the incorrect measurement of the phase proportions between the two, with the Low EBSP resolution 156 x 128 (20K pixels) data set correctly measuring 23% FeO and 50.5% Fe-BCC whereas the Ultra-Low EBSP resolution 119 x 91 (10k pixels) data set reports 40% FeO and 34% Fe-BCC. Industrial users that require accurate measurements of oxide scale proportions should carefully consider the EBSP resolution used to investigate their microstructures.
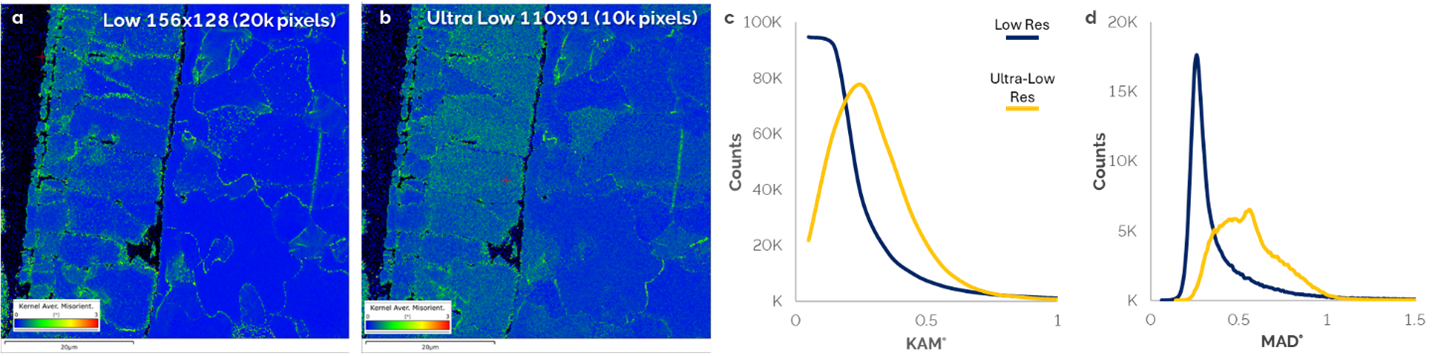
Figure 6. KAM Maps of Steel Oxide data from a) Low 156 x 128 (20k pixels) and b) Ultra Low 110 x 90 (10k pixels), c) and d) plots the corresponding average KAM and MAD values for each.
In Figure 6 the Ultra Low 110 x 90 (10k pixels) KAM map shows less accuracy at misorientations lower than 0.3° and indicates a higher noise level due to poor angular resolution (Figure 6b & c). This results in an artificially high KAM profile and is likely to overestimate the amount of deformation in a microstructure. The reduction in pixel resolution also results in a higher-than-expected mean angular deviation, proving that the 110 x 90 (10K pixels) does not have the accuracy required for many common use cases.
Conclusion
Ultra-Low EBSP resolution patterns of 110 x 90 pixels, totalling approximately 10,000 pixels, have been shown to be insufficient in three common use cases; correct orientation mapping of a TiAl alloy, phase differentiation between common Steel oxides and general deformation mapping using KAM. All three test cases highlighted the importance of selecting an appropriate EBSD pattern resolution for the measurement required and reminds users of the need to balance speed against the intended end result. Indeed, it was shown that in many cases vital statistical measurements were significantly affected by a reduction in EBSP resolution to 10,000 pixels. EBSP resolution should be considered as a key parameter in relation to the required outcome, and that a single set of acquisition parameters is not appropriate for all use cases.
References
[1] Humphreys F. J. Quantitative metallography by electron backscattered diffraction, Journal of Microscopy 195 (1999) 170 – 185. https://doi.org/10.1046%2Fj.1365-2818.1999.00578.x
[2] Humphreys F. J. Review - Grain and subgrain characterisation by electron backscatter diffraction. Journal of Materials Science 36 (2001) 3833 – 3854. DOI: 10.1023/A:1017973432592
[3] Jiang J. et. al. Measurement of geometrically necessary dislocation density with high resolution electron backscatter diffraction: Effects of detector binning and step size. Ultramicroscopy. 2013 Feb 1;125:1-9. https://doi.org/10.1016/j.ultramic.2012.11.003

