AZtecFeature Tips and Tricks – FeaturePhase - Detecting particles when it would otherwise be impossible
As I’ve spoken about in my previous blogs, analysing particles/grains/features is a really powerful technique for understanding your samples that draws together imaging from the electron microscope and EDS analysis. Typically, SEM images are used to determine where particles are (and the features’ morphology is measured from these images) with EDS data then being acquired automatically to give information on composition.
Most of the time, we use a backscattered electron (BSE) image to detect features as the contrast in this image type is related to the mean atomic z number of the material being analysed. This means that the BSE image can act as a proxy for variations in composition as features with different compositions often have different mean atomic Z numbers. This means that we can set up grey level thresholds to identify different features – including being able to tell where one feature ends and another begins.
However, sometimes, things aren’t ideal and two features which have different compositions appear the same in BSE images. This can happen in all sorts of samples – here we’ll start off by considering a geological example and then look at another one from additive manufacturing.
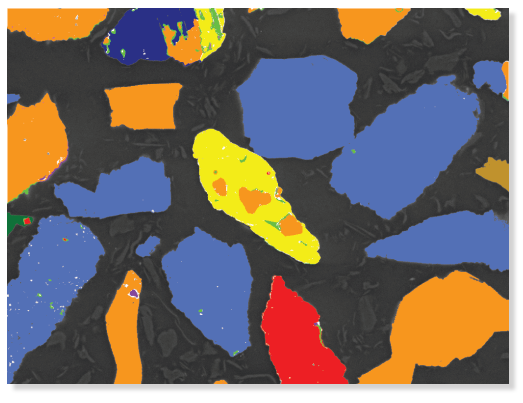
The image below shows a classic scenario. There are numerous particles and grains present in this sample that appear as saturated white – this often happens with high density phases in geological samples and can be a result of the way that the contrast and brightness has been set up to show the details of the rest of the grains.
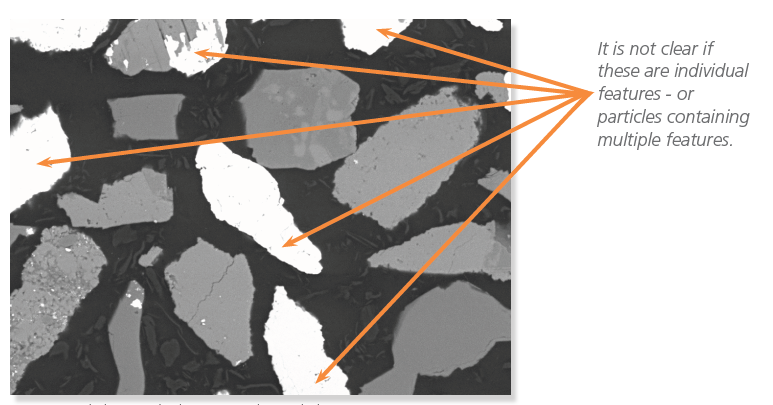
The problem that occurs here is that it isn’t possible to know whether the white particles that we see are single grains or particles containing multiple grains which happen to all be saturated white.
Of course, electron images are not the only source of information that we can gather on these grains with an electron microscope – we can gather other signals including X-rays in the form of EDS data as well.
A common way of collecting EDS data is mapping – collecting a spectrum from every pixel across an area and using that information to visualise variations in composition. This gives us an alternative view of features in our sample – this time in terms of actual composition rather than a proxy for it. We can use that mapping information to tell if a feature is made up of one composition or if it contains multiple grains of different compositions.
We have implemented this mapping-based approach, combined with our phase detection algorithm, AutoPhaseMap, and Feature detection in a function in AztecFeature called FeaturePhase. Its job is to see and detect features when it would otherwise be impossible to do so from an electron image. This could be because different features appear the same in an electron image, (as in this example), because of extensive surface cracks/scratches or because features sit on a complex background – all things that can make grey-level thresholding difficult or impossible. We can trigger FeaturePhase to work on specific regions that we have thresholded – e.g. the saturated white particles in this example, or we can apply it to whole fields of view.

he results of using FeaturePhase can be seen here. On the same field of view that we looked at above, you can see that the central particle, which was saturated white in the BSE image is, in fact, not a single composition throughout but instead has several grains within it of different composition. Without using FeaturePhase, we just wouldn’t have been able to see this.
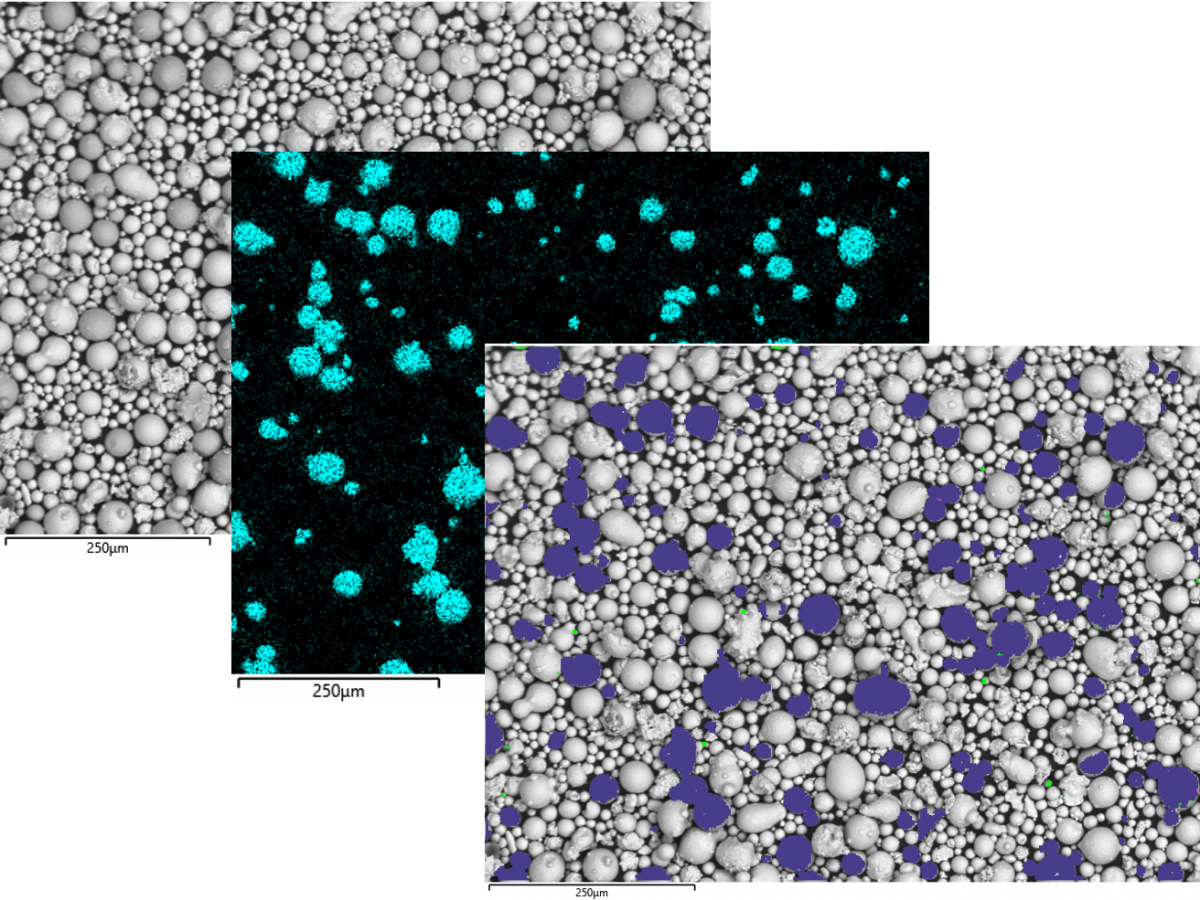
I’ve used a geological sample so far in this blog as it showed how FeaturePhase works really clearly, but it is equally applicable to a wide range of sample types – e.g. powders, wear debris, particles on alloys etc. – you can see an example of this below where I’ve used FeaturePhase to detect contaminant particles in an additive manufacturing powder. You can see from the left-hand electron image that it is very hard to distinguish the contaminant (Ti) grains from the surrounding (Ni) material. However, it’s very clear where the Ti is in the central map. After the FeaturePhase process has been run using that map, the features are extracted and measured – as seen in the right-hand image. Fundamentally, FeaturePhase has detected the features when it would otherwise be very difficult, if not impossible to do.
Hopefully you’ve seen that FeaturePhase is a really powerful approach for performing automated Feature analysis when it would otherwise be impossible to do so. For more information on how it works, get in touch with a member of the team to organise a remote demonstration now.
Book a Demo