18th November 2020 | Author: Dr Rosie Jones
What happened when I challenged AZtecWave to reproduce my electron microprobe results
Seven years ago I completed a PhD in Geology. My PhD research involved performing various geochemical analysis on igneous rocks collected from the Central Andes of South America, with the aim of investigating the geological evolution of the region. A key part of this research was to compositionally characterise minerals present in various igneous rocks.
To obtain quantitative compositional data I went to what was considered the ‘go-to’ instrument for this type of analysis – the electron microprobe (often referred to by the name of the technique – EPMA). I collected major, minor, and trace element data from different minerals of interest in polished thin sections prepared from igneous rock samples. This data not only enabled me to correctly identify mineral types, but to also draw conclusions on the composition and evolution of the magma from which the various minerals crystalised. I also used the elemental data to calculate the temperature and pressure at which the minerals crystalised. The strong impression that I was left with as a PhD student was that Wavelength Dispersive Spectroscopy (WDS) via the electron microprobe was the only technique available for obtaining quantitative elemental compositions, when requiring spatial context/information (e.g., the relationships of minerals to each other in the sample).
Recently we launched AZtecWave, our solution for combining the resolution and sensitivity of Wavelength Dispersive Spectroscopy (WDS) with the speed and flexibility of Energy Dispersive Spectroscopy (EDS).
I was interested to see how results from this SEM-based, combined EDS-WDS analysis in AZtec, compared to the results I obtained using the electron microprobe during my PhD.
I selected a thin section of a granitoid rock to do some initial investigation. I analysed it using a FEG-SEM combined with a Wave WDS spectrometer and an Ultim Max 170 mm2 EDS detector. I used an accelerating voltage of 20 kV and a beam current of ~20 nA. The mineral I chose to look at in these initial investigations was plagioclase feldspar. I planned to measure the major elements (Si, Al, Ca, Na) by EDS, using the standardless quantitative approach in AZtec, and the minor elements (K, Sr and Fe) via WDS. Prior to measuring the plagioclase feldspars, I measured some pure element/simple compound standards (KBr, SrF2, Fe) in a 55 element standard block, to enable the WDS measurements on the sample to be quantified.
I set up the WDS acquisition conditions for K, Sr, and Fe to be the same as those used by the electron microprobe (e.g., crystal, element line). The beam current used on the electron microprobe was higher than that on the SEM (~100 nA, compared to ~20 nA), so I increased the counting times for the SEM-based WDS to make the two sets of results comparable (the exception being for K, which was measured first and counted for a shorter time due to its volatility under the electron beam). The EDS data was automatically collected at the same time as the WDS, but the measurement was set to complete after just a couple of seconds to ensure limited loss of the Na, which is also mobilised by the electron beam. The acquisition settings for the minor elements by the two different techniques are summarised in the tables below.
| Electron microprobe acquisition settings |
| Element |
Beam Current (nA) |
Line |
Crystal |
Peak Live Time (s) |
Background Live Time (s) |
| K |
100 |
Ka |
PET |
20 |
10 |
| Fe |
100 |
Ka |
LIF |
40 |
20 |
| Sr |
100 |
Ka |
PET |
40 |
20 |
| SEM-WDS acquisition settings |
| Element |
Beam current (nA) |
Line |
Crystal |
Peak Live Time (s) |
Background Live Time (s) |
| K |
20 |
Ka |
PET |
20 |
10 |
| Fe |
20 |
Ka |
LIF |
200 |
100 |
| Sr |
20 |
Ka |
PET |
200 |
100 |
The average plagioclase feldspar composition determined by electron microprobe and SEM-based combined EDS-WDS are presented in the table below. In both cases the quantitative results are shown as unnormalized, with oxygen calculated by stoichiometry, and the elemental abundances presented as oxide wt. %. The minor elements are highlighted in purple and the percentage relative difference between the two techniques is found to be ≤3 %.
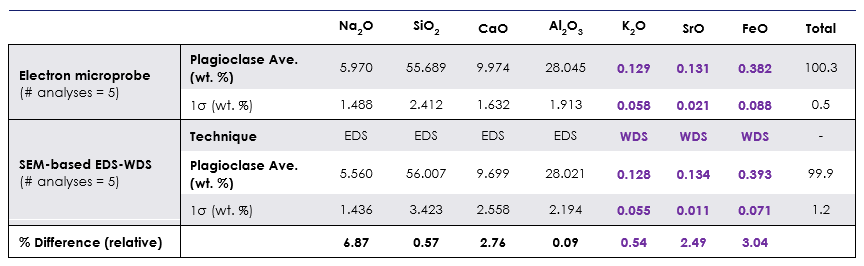
As is shown, there is good agreement between the results obtained via electron microprobe, and those obtained via SEM-based, combined EDS-WDS in AZtecWave. There is some natural variability in this sample, and in this case, I cannot be completely sure that I analysed exactly the same points on the minerals as I measured previously via electron microprobe. However, I believe the results of this initial investigation are very promising. In the near future I am planning to take the same approach with a very well characterised geological sample that has been analysed by electron microprobe and has information available on the exact points analysed. Look out for an application note on this in due course.
Finally, what I believe SEM-based, combined EDS-WDS analysis offers geologists and materials scientists is a very versatile tool with the ability to collect electron images, quantitative compositional data, and other datasets (e.g., EBSD, CL imaging, etc), all in one SEM analytical session. This brings the major advantage of reducing the time needed to go between, and train on, different instruments.


