In any subject area, there are topics that always seem to be that little bit more challenging. As an undergraduate studying geology, it was typically mineralogy and crystallography that furrowed my brow most of all (30 years on, I still struggle to interpret an optic axis figure generated by the Bertrand Lens in a petrographic microscope).
By the time I moved into research, it was often the concept of slip systems and dislocations that proved to be a constant struggle to understand. And I am certainly not alone in this: many researchers in both materials science and the geological sciences find it difficult to understand properly the role of dislocations in the plastic deformation of materials.
Unfortunately for those of us who struggle in this field, dislocations are important. Really important! They control the way materials deform in response to stress and strain, and hence characterising and understanding dislocations is critical if we want to comprehend and control the physical properties of our samples.
Another problem associated with dislocations is that they are atomic-scale features that are challenging to measure. We can image them using electron microscopy; most commonly in the transmission electron microscope (TEM) but increasingly also in the scanning electron microscope (SEM), using the electron channelling contrast imaging (ECCI) technique. However, these approaches are time consuming and typically can only focus on a few grains at a time, so are not suited to statistical studies of dislocations. Bulk techniques, such as X-Ray diffraction, can provide estimates of the dislocation densities within samples, but we lose the critical detail about local variations and types of dislocation.

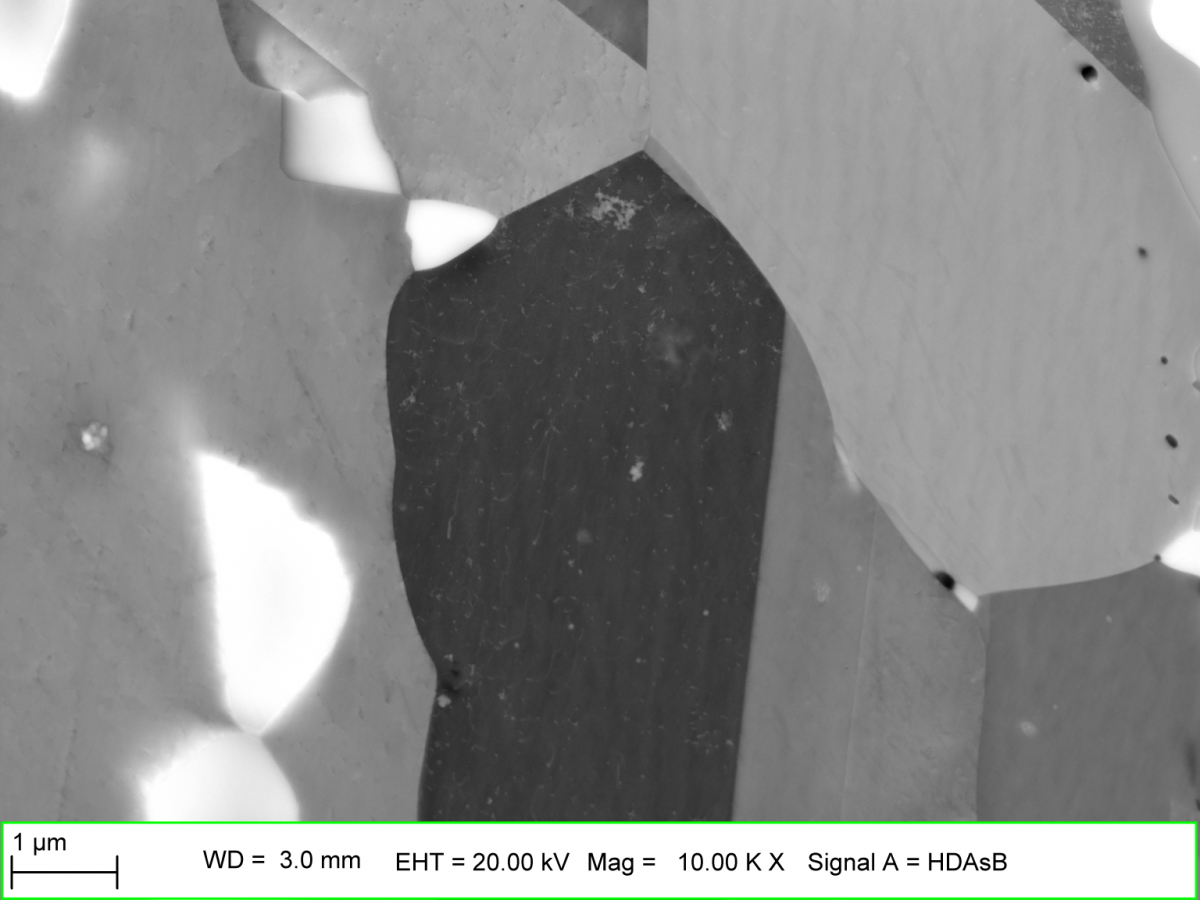
Electron Channelling Contrast Image of a duplex steel, showing abundant dislocations within the individual grains
This is where electron backscatter diffraction (EBSD) can help. For many years, researchers have used EBSD to glean information about dislocations and their densities within samples. Gold standard has been the use of so-called “High Resolution EBSD” (HR-EBSD); here, high quality EBSD patterns are compared to an undistorted reference pattern to measure very small-scale orientation changes (e.g. down to 0.005°), which in turn can be used to determine the localised dislocation density.
However, HR-EBSD is a slow process, typically requiring many hours of data collection and offline reprocessing to extract the necessary information from a relatively small number of grains (although it’s worth noting that HR-EBSD does also provide other useful data, such as the elastic strain).
So, what can we extract from conventional EBSD orientation maps, collected at high speeds from large areas in our samples? Well, the answer is actually “quite a lot”. There have been many academic papers published in the past 15 years that propose techniques for extracting dislocation information from EBSD data. Some are more rigorous than others, but they are all underpinned by some fundamental research from more than half a century ago – Nye’s 1953 paper “Some geometrical relations in dislocated crystals” in which the relationship between the curvature of the crystal lattice and the density of geometrically necessary dislocations (GNDs) was first defined.
In our EBSD data processing software, both the old Channel5 and our latest AZtecCrystal software, we already have map components that can provide some estimates of the GND densities for cubic materials. For many researchers this is enough, even though the concept of a single GND density value for a sample is only of limited value. In the next release of AZtecCrystal, due in just a few weeks’ time, we are introducing a new advanced dislocation analysis tool.
We have based this on the Weighted Burgers Vector (WBV) method that was first proposed by Wheeler et al. (2009 – Journal of Microscopy, 233, p. 482–494); this approach has many advantages over some of the alternative techniques in that it does not make any assumptions about the types of dislocation, it can be used for any crystal symmetry, and it provides information about the direction of the Burgers vectors themselves.
This last part is particularly useful: now, in just a few seconds, we can determine the orientation of the Burgers vectors for low angle boundaries and therefore identify the dominant slip systems with much more confidence.
Over the past few weeks, I’ve had the opportunity to test this new tool on a wide range of different samples, ranging from highly deformed Ti alloys to the analysis of threading dislocations in GaN thin films. Many of those results will be available once the product is launched, as will some more detailed background information about the WBV method on our ebsd.com website.
For this post, I wanted to turn to a sample that has a bit more of an emotional pull.
Even now, after more than 25 years working with EBSD and electron microscopy, I still feel like a geologist at heart and tend to return from holidays with one or two rocks tucked away in the back of our car (Admittedly, my geologist wife is also partly to blame!). Just occasionally, these rocks show some really interesting features, and this is the case with a sample we collected from NW Scotland a few years ago.
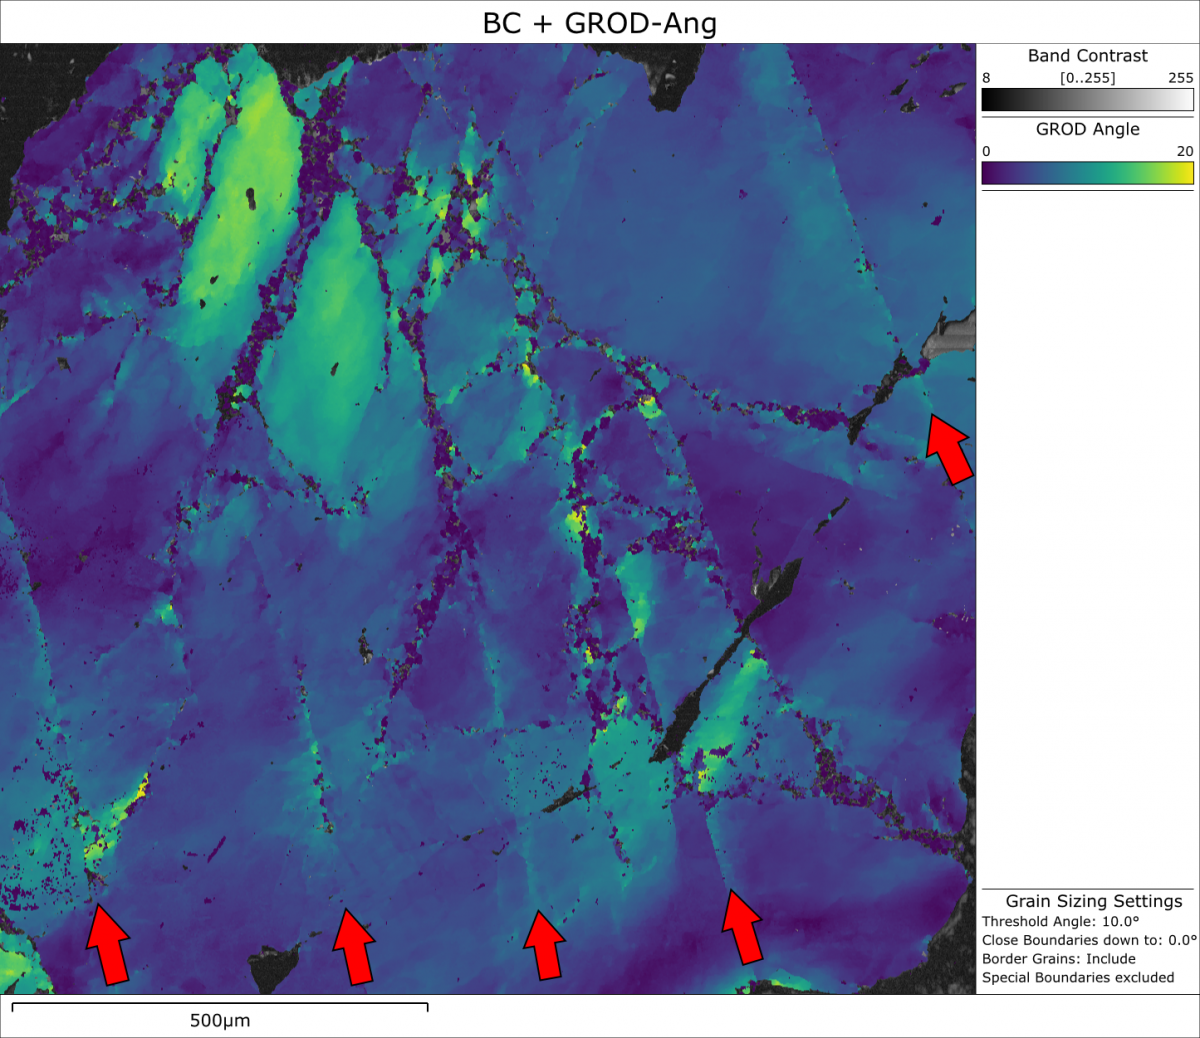
This rock is a “pseudotachylite” – a rock that has been produced in an earthquake, with frictional heating resulting in some melting and the breakup of the surrounding material into angular fragments. When analysed using EBSD, the grains of quartz adjacent to the glassy veins (melt that was rapidly quenched) show intriguing parallel bands of deformation, as is shown in the grain relative orientation deviation map below.

Grain relative orientation deviation (GROD) map of a quartz grain adjacent to the melt zone in a pseudotachylite. The arrows mark prominent sub-parallel bands of deformation.
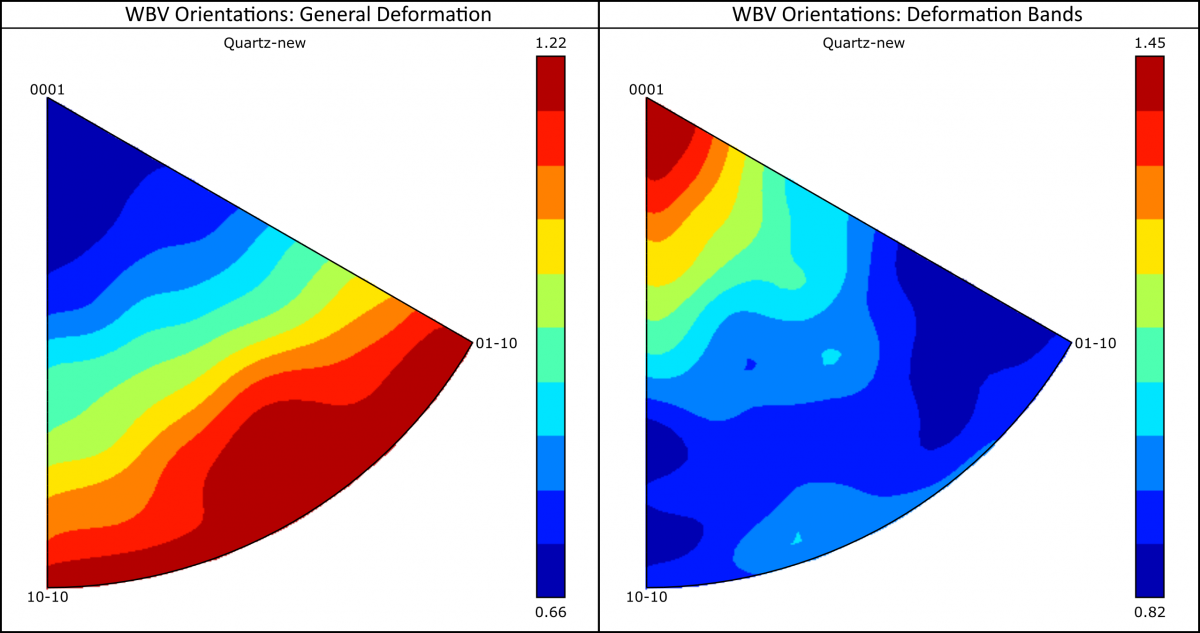
When I analysed this dataset using the new dislocation analysis tool in AZtecCrystal, the majority of the low angle boundaries show Burgers vectors lying in the quartz basal plane (see the inverse pole figure plots below). Couple this with boundary rotation axes clustering close to <01-10>, it is consistent with slip on the low temperature “basal <a>” slip system (0001)<11-20>.
However, when I select just the parallel deformation bands, we see a completely different Burgers vector orientation. Here, the clustering is close to the c-axis, consistent with activation of the less common, high temperature “prism-c” slip system, (10-10)<0001>. From this near-instantaneous result, we can differentiate between the low temperature deformation in this quartz grain and the deformation bands that have almost certainly originated from the high temperature earthquake event itself.

Inverse pole figure plots showing the orientation of the Burgers vectors in the crystallographic reference frame. Left – the region of general deformation within the quartz grain, showing Burgers vectors lying in the basal plane. Right – the narrow, parallel deformation bands, showing Burgers vectors clustered close to the <c> direction.
It has been fun to load up a few old datasets and examine the dislocation structures in a bit more detail. Sometimes, it is enough just to examine the GND densities, but more frequently, it is the Burgers vector orientations that really reveal critical information about the slip systems and the style of deformation within our samples.
This new functionality within AZtecCrystal should be a significant step forward, helping our EBSD customers to interrogate their samples without needing to resort to laborious TEM, HR-EBSD or ECCI methods. And for me, it has just made the analysis and interpretation of dislocations that much easier – and that is progress indeed!