Why abstract season is stressful for microscopists
Every year there seems to be an increasing number of microscopy-focused meetings, workshops and international conferences. For those of us focused on the EBSD technique, this year is particularly busy, with topical meetings in both the UK and in the US as well as the triennial International Conference on Textures of Materials – ICOTOM – this year held in Japan. Throw into the mix the European Microscopy Congress in Copenhagen and the annual Microscopy and Microanalysis meeting in Milwaukee and the calendar becomes rather crowded. To make matters worse, the organisers all want abstracts submitted in February so, for many of us, the past few weeks have been spent strategically planning subjects for talks and posters to be presented later in the year.
I have been fortunate enough to be invited to a couple of meetings this year, specifically tasked with presenting a review of the developments in the EBSD technique and their impact on the fields of both materials science and geology. This has had me looking back at some old data collected from a quartzite rock during my PhD in the mid-1990s. In those days EBSD held much promise, but for most laboratories (including ours) it was a laborious technique that involved late nights at the SEM squinting at noisy images to (hopefully) make out some Kikuchi bands. Then we had to blindly trust our early EBSD software to convert a few manually-drawn lines on the screen into crystallographic orientations. It was slow progress: a good weekend might give 1,000 orientation measurements and that would be followed by weeks of data manipulation to generate lists of boundary disorientations, pole figures and even some rudimentary maps. A few years later EBSD systems were improving rapidly as digital CCD detectors entered the market, so I took the opportunity to repeat my earlier analyses, this time using automated mapping at speeds of several points per second (it seemed fast at the time!). A whole night’s analysis generated usable orientation maps such as shown in figure 1a – even though the indexing rate was relatively poor (typically 75-80%), there was enough information to extract all the relevant information about the microstructure in a matter of a few hours. What once took a month could now be completed in 24 hours.
Fast forward to the present day and we are spoilt by the technology at our disposal: our Symmetry EBSD detector led the way in 2017 as the first CMOS-based detector on the market. This resulted in unprecedented analysis speeds but, perhaps more importantly for the study of non-metallic samples such as my quartzite, the fibre-optic lens design (still unique to this day) delivered exceptional sensitivity, still significantly better than any other commercially-available detector. This meant that I could once again repeat my earlier experiment, but this time with mapping speeds of about 1000 points per second, with indexing rates close to 100% and without using high beam currents. The map in figure 1b took 32 minutes to collect and contains more than 15 times the data than in the earlier analysis, bringing the time to characterise my sample down from 24 hours to under 1 hour. Now that really is progress.
Figure 1. EBSD maps from a deformed quartzite rock (a) Orientation map collected in 13 hours in 2001 (120,000 measurements) (b) Orientation map collected in 32 minutes in 2017 (1.9 million measurements).
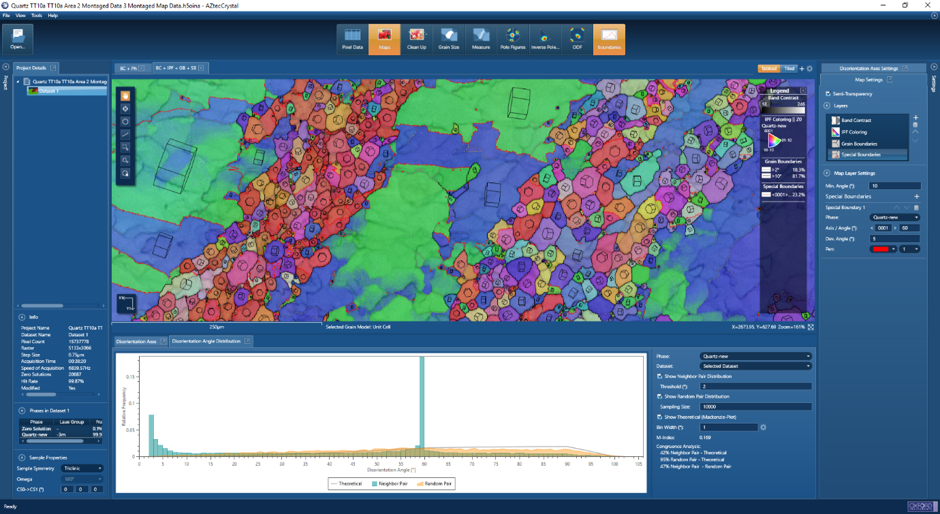
It is exciting to be closely involved in a technique that has developed so quickly, transforming it from a niche product to a mainstream tool that can be widely applied across many application fields. However, it’s not all about detectors and acquisition speeds: to analyse effectively the increasingly large datasets generated by our range of ultra-fast CMOS detectors, we have had to completely re-develop our data processing software. This month we launch AZtecCrystal, the culmination of several years’ focus on EBSD data processing. Our aim has been to develop data processing software that matches the advances in detector technology and acquisition speeds, making it easier for researchers to extract the necessary information from their datasets regardless of their level of expertise. The result is software that is intuitive to use yet offering the full spectrum of analytical tools necessary for extracting key data from EBSD analyses. And, importantly, it is fast. As part of product testing, I have enjoyed collecting some extremely large datasets (> 60 million points) from a whole range of samples and using them to test the processing power of AZtecCrystal. Happily, this has given me the chance to once again take a look at my trusted quartzite sample - the screenshot below shows the analysis of a “small” 16-million-point dataset, graphically highlighting the individual grain orientations as well as the disorientation angle distribution. Importantly the development does not stop here – we have many projects underway across all facets of EBSD, so look out for future releases and exciting new functionality.
Looking back at this progress through time has helped me to crystallise my thoughts (please forgive the pun!) on at least one of my presentations for later this year. Now I just need to sort out the other 5 abstracts!
Hopefully I’ll see many of you at these microscopy meetings during 2020; in the meantime, good luck with your abstract writing and please don’t get too stressed.


