TEM sample preparation is not always straight forward. With a range of complex hurdles that must be completed to ensure a good sample is prepared, taking shortcuts and rushing key preparation steps can often result in dirty samples and poor EDS results. Following on from my previous blog, I will outline key things to consider when preparing and mounting TEM samples and what can be done if your sample is dirtier than expected.
Today I will focus on:
- Turning your sample around – investigating the effects of TEM grid and FIB grid orientation
- Combating carbon contamination – Options to help remove and reduce carbon contamination from TEM samples
This advice should help reduce spurious peaks in your EDS spectra, improve the count rate of your system and prevent carbon build-up during EDS acquisition.
Turn your sample around!
Sample geometry is often overlooked when it comes to TEM, but the orientation of sample grids and FIB grids can play a key role in optimising your EDS collection. TEM sample grids are often comprised of a lacey carbon film that has been deposited onto one side of a Cu support grid. The grid is nominally 25 µm in thickness, therefore if a grid is loaded into a sample holder upside down then you have surrounded your sample with 25 µm high Cu walls. This can prevent line of sight between your region of interest and the EDS detector and can generate spurious Cu X-rays. This is easily avoided by placing your sample into the holder for lacey C you want the carbon side, which will appear darker coloured, facing upwards compared to the shiny clean Cu of the undeposited side.
A similar scenario must be considered when loading FIB samples into the TEM. Your FIB sample will have most likely been prepared in one of two positions either as a flag on the side of a post or on top of one. It is interesting to look at the size of the TEM sample compared to the FIB grid to gain some perspective on the influence the grid has on your EDS spectrum. Since your sample is directly attached to the FIB grid, typically a large mass of Cu, the grid can potentially have a large influence on your results. The image below highlights the effects of shadowing, which reduces the total x-ray counts in a spectrum, as shown by spectrum C. It also highlights the spurious X-ray generation of Cu X-rays originating from the FIB grid and not the sample, this can be seen in varying quantities in spectra A, B and C, sample orientation can be used to minimise spurious X-ray generation. Within the TEM, the EDS detectors are always positioned 90° away from the main axis of the sample holder, parallel to the alpha tilt direction. With this knowledge, you should be able to position your FIB grid to maximise the line of sight between the sample and detector and reduce the exposure of the FIB grid to the electron beam and detector. An example of this can be seen below in configuration A, where there is a clear line of sight between the sample and detector.
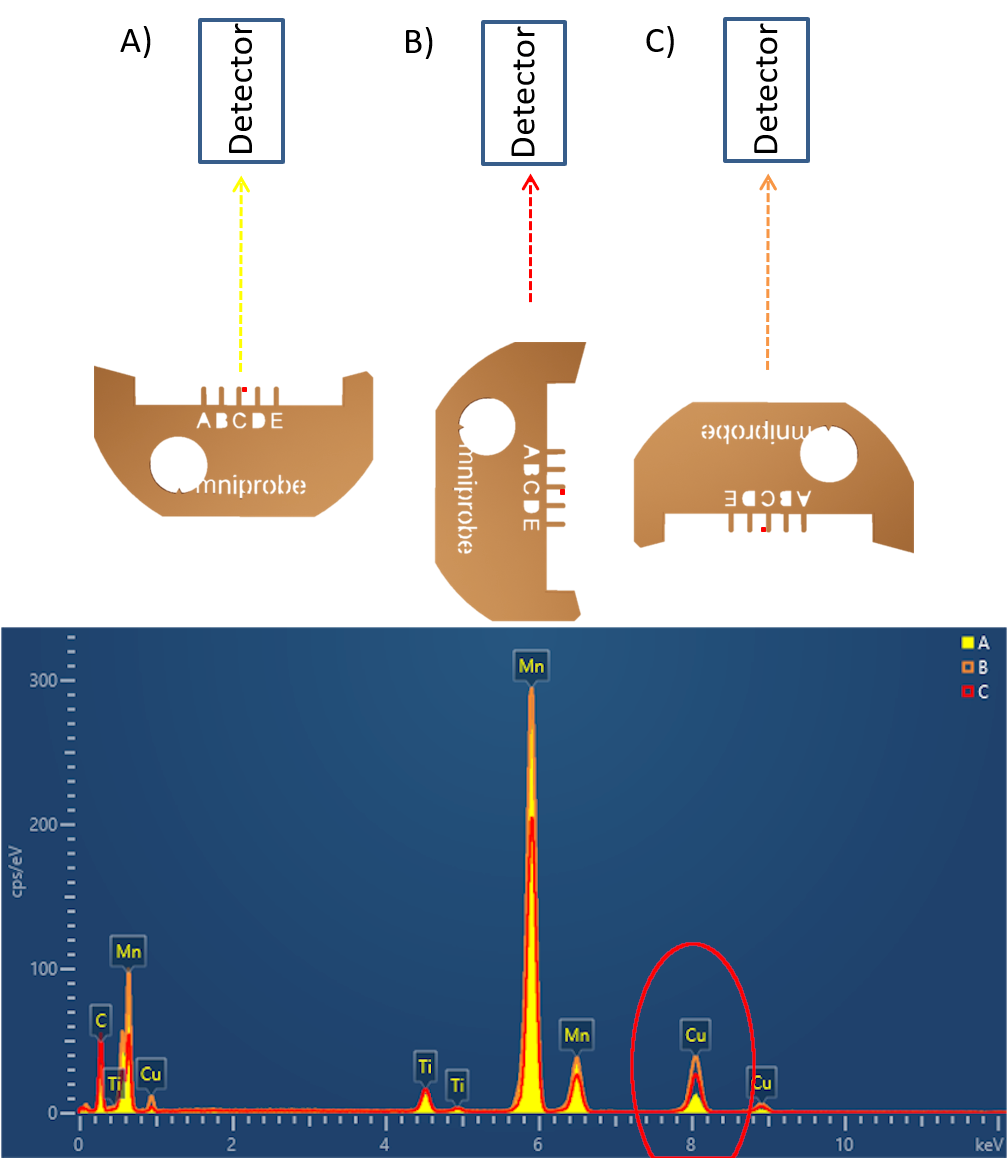
Examples of EDS spectra acquired from 3 different FIB grid orientations, highlighting the effects of FIB grid orientation on the EDS spectra. Configuration A shows the effects of a clear line of sight between the sample and detector, in this configuration the spurious Cu signal from the FIB grid is minimised and the Mn signal from the sample maximised. Configuration B highlights the generation of spurious Cu signal from the Cu FIB pillar infringing the line of sight between sample and detector. Configuration C highlights the effects of shadowing from the FIB grid, in this configuration the signal from the sample material is reduced and the spurious Cu signal increased
Combating carbon contamination
It is a fairly common occurrence that, upon acquiring a beautiful EDS map and returning to the microscope image, to find a large black square of carbon has deposited itself on the surface of your sample, as shown below, and your region of interest is no longer usable. This is a result of the electron beam interacting with surface hydrocarbons and is an effective measurement of the cleanliness of your sample.
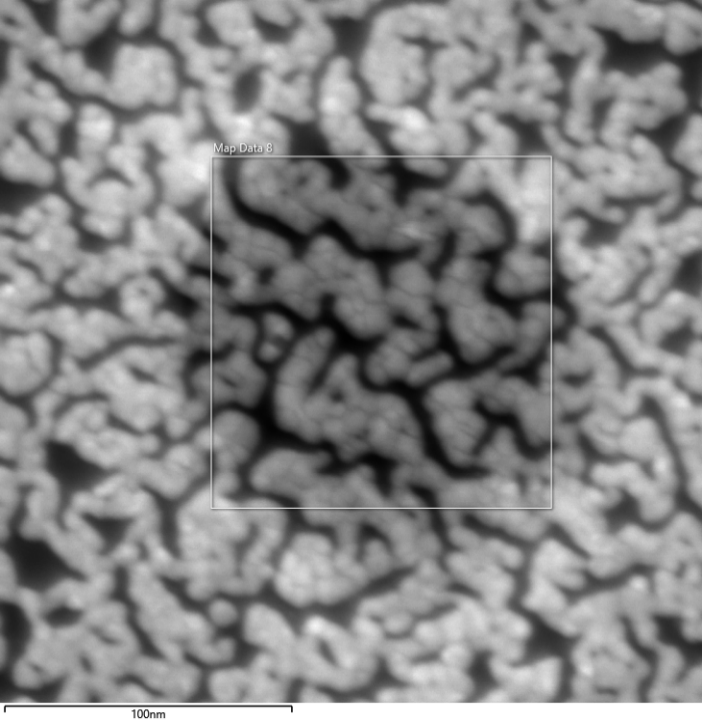
An example of carbon contamination formed on AuPd nanoparticles during mapping.
The three most common sources of contamination are sample preparation, sample storage and dirty lab equipment. It is almost impossible to fully remove all sources of contamination. Best practice is to reduce it as much as possible through awareness of the different sources of contamination and options to clean samples before analysis.
During mechanical sample preparation, the main source of contamination is from dirty lab equipment, notably the use of dirty cleaning alcohol. TEM samples are cleaned repeatedly during preparation, therefore, it is advised that during the final stages of sample preparation, the sample is washed with fresh isopropanol and not placed into the same beaker of alcohol that has been used during the initial preparation steps. With respect to FIB sample preparation, refer to my previous blog(Hotlink) in which I emphasised the importance of low kV cleaning during the final stages of sample preparation. Not only will this remove embedded gallium from your sample but it will help reduce the number of hydrocarbons attached to the surface of your sample.
Once a sample has been prepared, the two most popular methods of cleaning TEM samples ex situ are plasma cleaning and sample baking. Plasma cleaning is often seen as the easier approach as samples can be loaded into your TEM sample holder and the holder placed in the plasma cleaner. This is a great way to remove contamination from a sample but care must be taken to ensure the plasma is not too intense, as it can damage carbon based materials. Another widely used method for preventing carbon contamination is by baking samples at 80 °C. This can be undertaken ex situ in a sample heater or oven or in situ utilising a hot stage. The advantage of this approach is that the warm temperature is typically hot enough to remove hydrocarbons and outgas samples, but not hot enough to damage your sample. The disadvantage of this approach is that it is time-consuming, with users typically baking a sample overnight or for several hours.
Still struggling to get the most out of your sample? Get in touch with one of our experts today!
Get in touch