Can you improve the performance of cathode materials within Li-ion batteries using EBSD?
Currently a lot of development effort is going into improving the performance of Li-ion batteries. These batteries support a wider range of applications, however, focus on improvements is generally being driven by the automotive industry as the demand for higher quality electric cars grows. Improving the performance of a Li-ion battery can be done by improving the performance of each of the components individually. The chemistry of the cathode material varies depending on the application, the most commonly used are based on nickel, cobalt and manganese (NCM) mixed at different ratios. Some cathodes with the same chemistry appear to perform better than others, so it is crucial to understand how and why the cathode material changes during the lifetime of the battery.
How can EBSD help this?

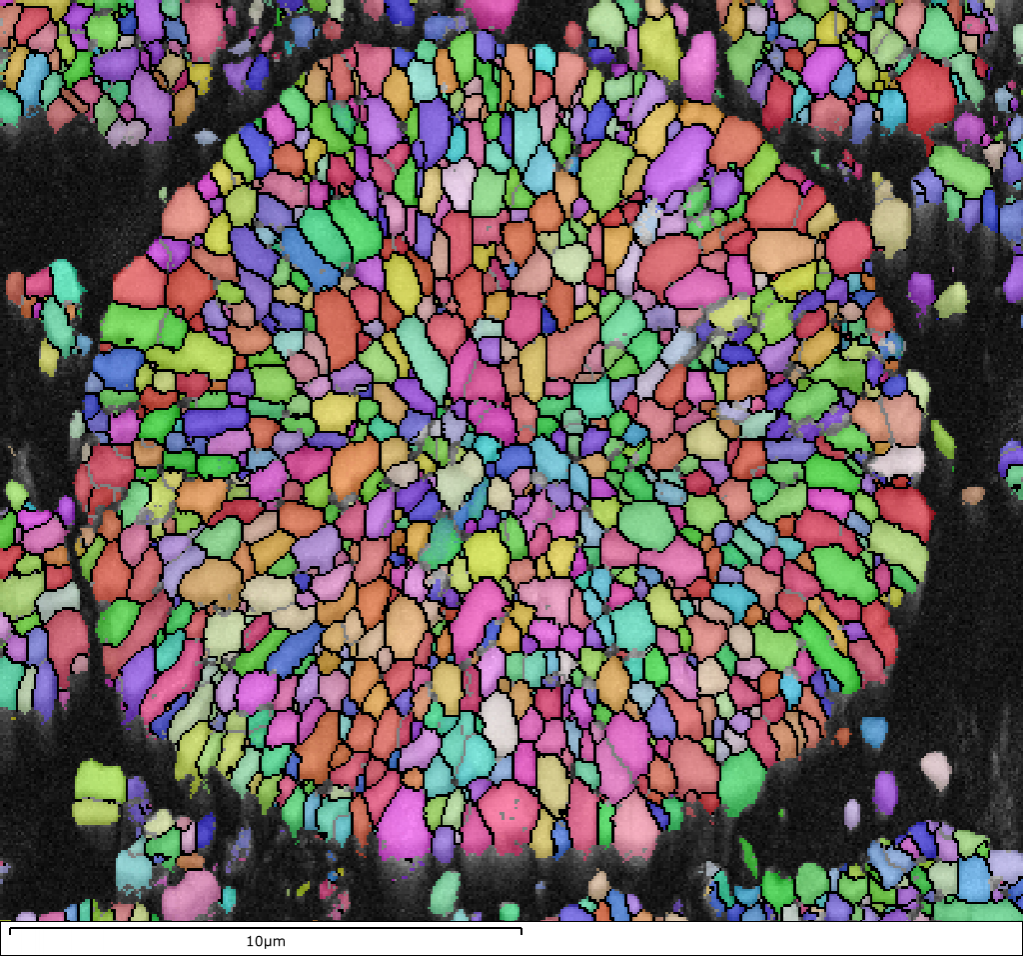
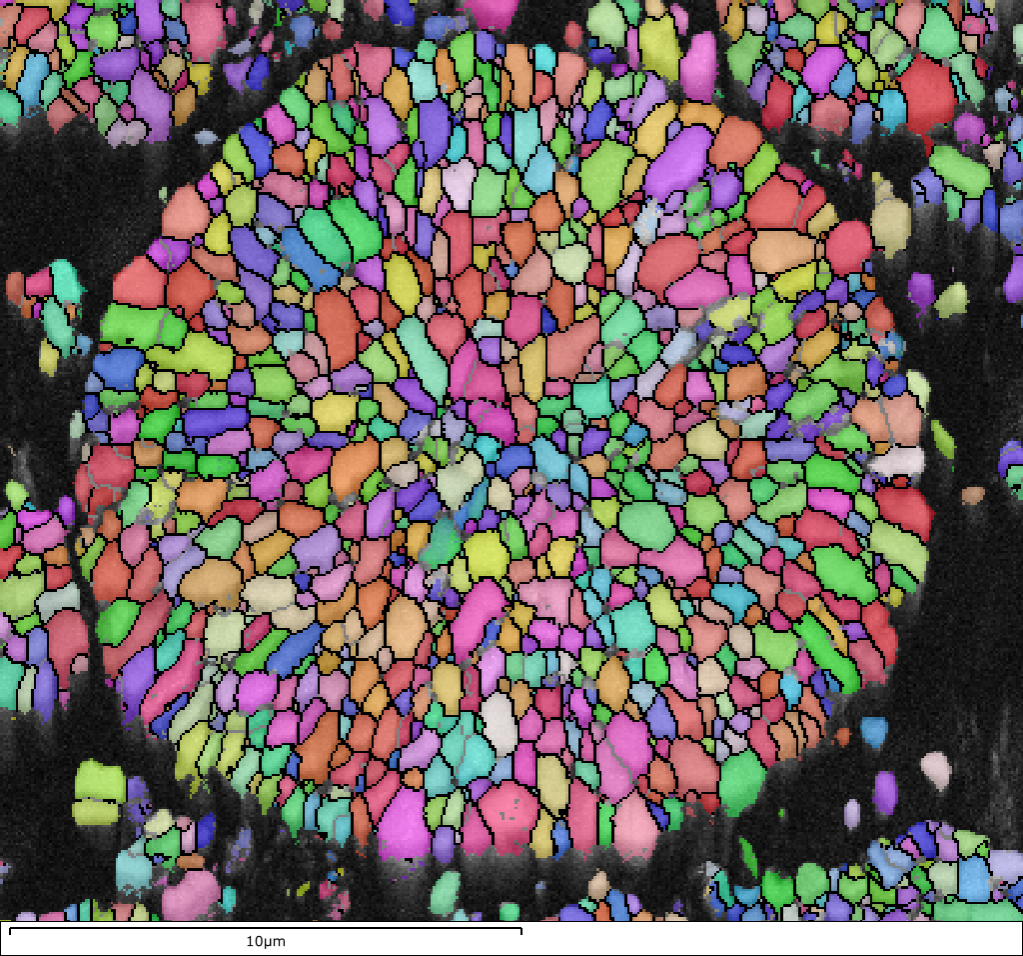
Figure 1 - EBSD orientation map from ion milled NCM cathode material.
The grain size in these materials can vary quite a lot and, in some cases, the spatial resolution of conventional EBSD might be a limitation. The solution in this case might be TKD (Transmission Kikuchi Diffraction) which has been successfully applied to many other applications. Recently TKD has also been used on the NCM 811 material, some data was shown in our battery webinar which you can watch here.
If the EBSD system is installed on a FIB, then it is easy to first thin the sample using the FIB and then position the sample in a suitable geometry for TKD analysis. The example below shows a powder particle which has been attached to a grid and thinned to electron transparency before being positioned for TKD analysis. The electron image is acquired using the FSD diodes on the EBSD detector which generates an image showing the orientation differences in the sample. Next to the electron image there is shown an EBSD orientation map acquired from the sample.

Figure 2 - TKD sample of NCM 811 particle prepared in FIB. a) FSD image of particle. b) TKD orientation map. Data provided by WMG, University of Warwick in collaboration with JLR.
EBSD and TKD are well suited techniques for obtaining grain size, boundary and texture information from these types of materials. This helps to quantify the differences which can be observed in the electron images enhancing the understanding of what happens to the cathode materials during use.
Back in 2004 I joined a small Danish company called HKL Technology which later became part of Oxford Instruments, it was a company dedicated to EBSD – hardware and software. Having worked with EBSD for a relatively long time, it is great to see how improvements to detectors (Symmetry), software (AZtecHKL and AZtecCrystal) and the introduction of new techniques such as TKD are being used to solve problems in novel application areas like batteries. 16 years ago, I would not have thought that EBSD would become a commonly used technique for battery materials however the reality is that power of the technique is opening doors to new areas and supporting developments of future technologies.
Improve the performance of your Li-ion batteries today.
Book a Demo


