At Oxford Instruments NanoAnalysis, we recognise that all EDS users are not the same, neither in their requirements nor in their level of EDS experience. They can range from those with no EDS experience who want to carry out a simple analysis to those who have advanced knowledge who want to push the system to its limits. To fully satisfy such a wide range of users, we decided to develop two software platforms:
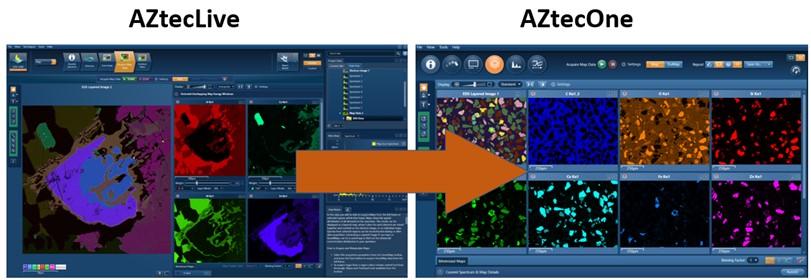
The first is AZtecLive, which supports all our EDS, EBSD and WDS techniques and is our main flagship product. It has a whole host of dedicated software options to suit a myriad of advanced application needs. The second is AZtecOne This was initially designed for TableTop Microscope (TTM) users. We discovered that these new users were generally new to electron microscopy and EDS, so required a simple and easy-to-use software interface to match that of the TTM.
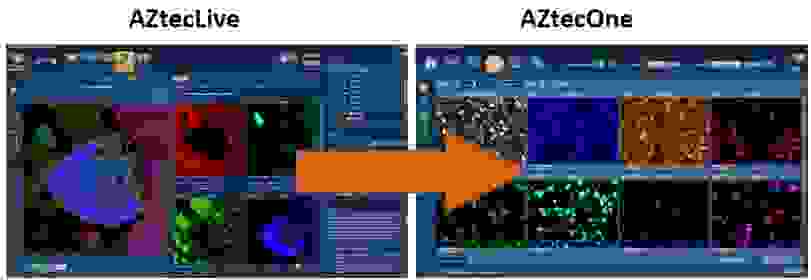
If you compare the two platforms, you can see that AZtecOne removes many more advanced functionality and workflows.
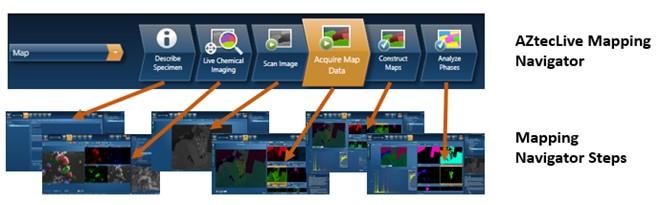
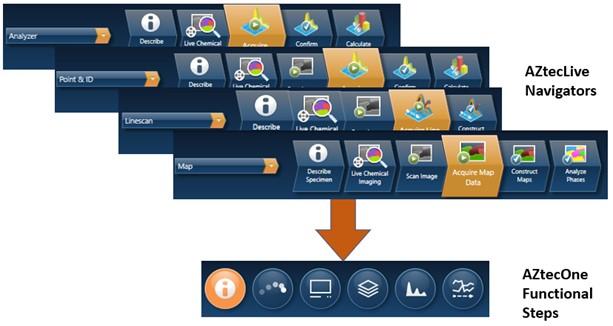
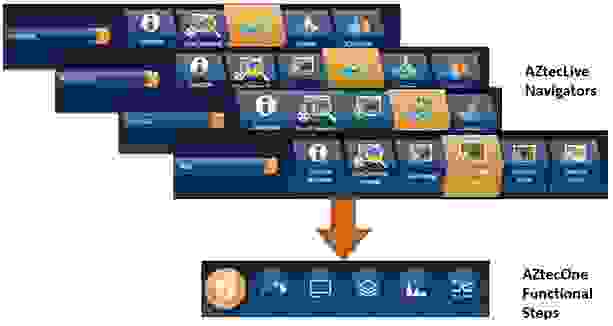
AZtecLive is built around a navigator concept with discrete steps that take the user from start to finish in a sample analysis. Each step has comprehensive settings to ensure a wide range of experimental conditions can be selected.
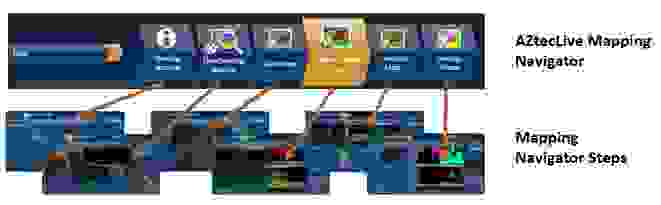
Although these navigators help the most inexperienced of users perform an analysis, they can still be intimidating. AZtecOne replaces these navigators with simple functional steps, where all the tools to complete a simple task are visible to the user.
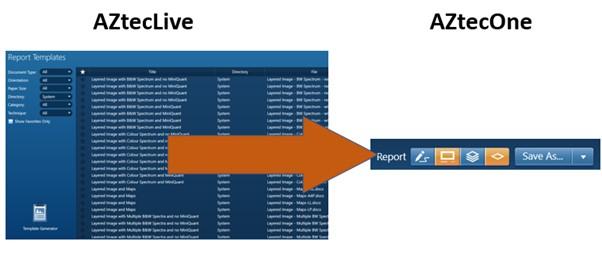
Even reporting takes the comprehensive yet sometimes overwhelming list of report templates and replaces them with a simple content chooser.
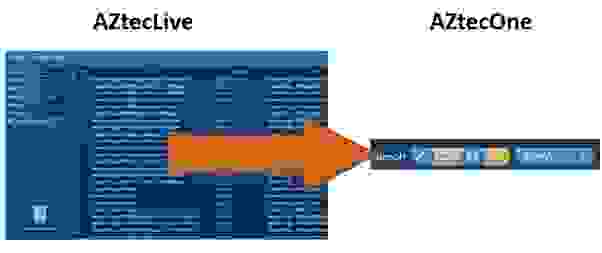
You just decide whether you want sample details, electron image, maps, spectra and quant results in your report. Then AZtecOne chooses the appropriate report template and populates it with your data.
This redesign of the interface means that with just a few mouse clicks, you can complete an analysis and report your results.
Now this simplification of the interface does not mean that you have to make a sacrifice in the quality and accuracy of your results. All the power and accuracy of AZtecLive is still there in AZtecOne. For example, one of the most common areas where the novice user needs help is when interrogating a spectrum to determine what elements are in their sample. AZtecOne uses the same Tru-Q technology used in AZtecLive. This means that even on a complex sample, each peak in the spectrum is automatically identified, labelled and quantified instantly.
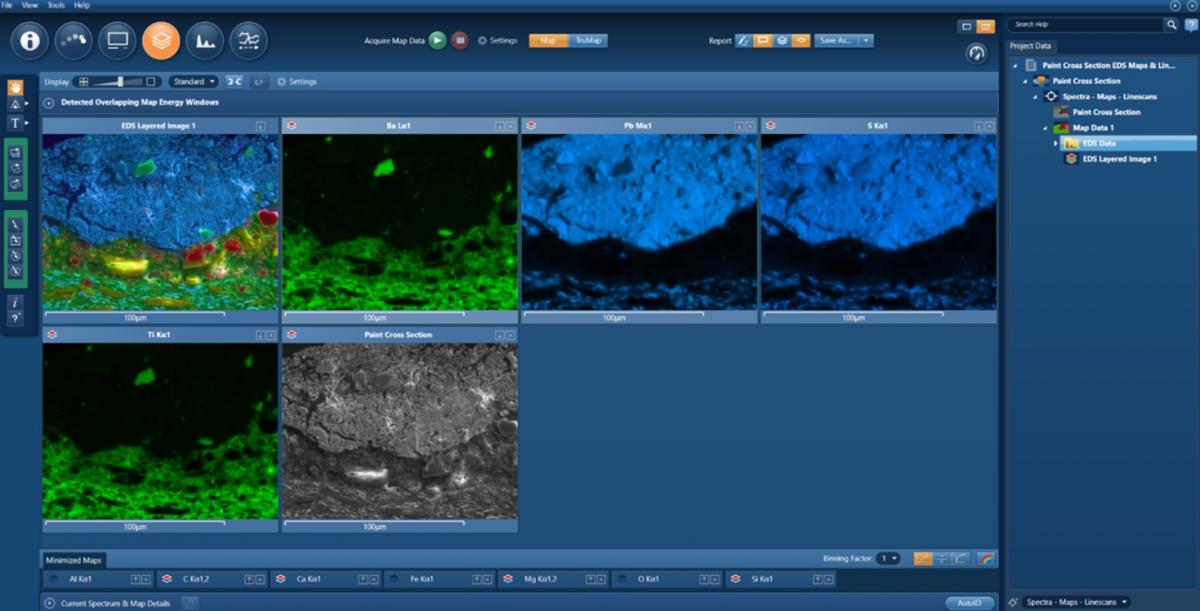
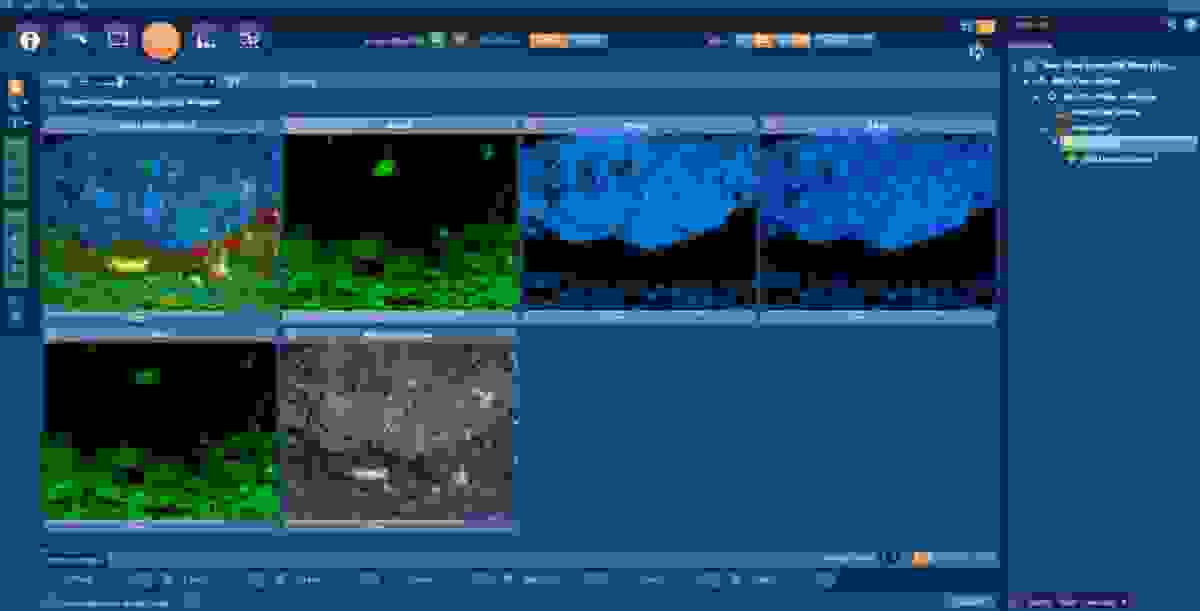
This ensures that you can be confident of any analysis of a point on your sample. But when you want to see how individual elements are distributed over your sample, there are other ways that AZtecOne can help. In the example below, you can see that we have acquired maps for Pb, S, Ti and Ba from a paint sample. We can see that the Pb and S maps have the same distributions and, similarly, that the Ti and Ba maps also have the same distributions.
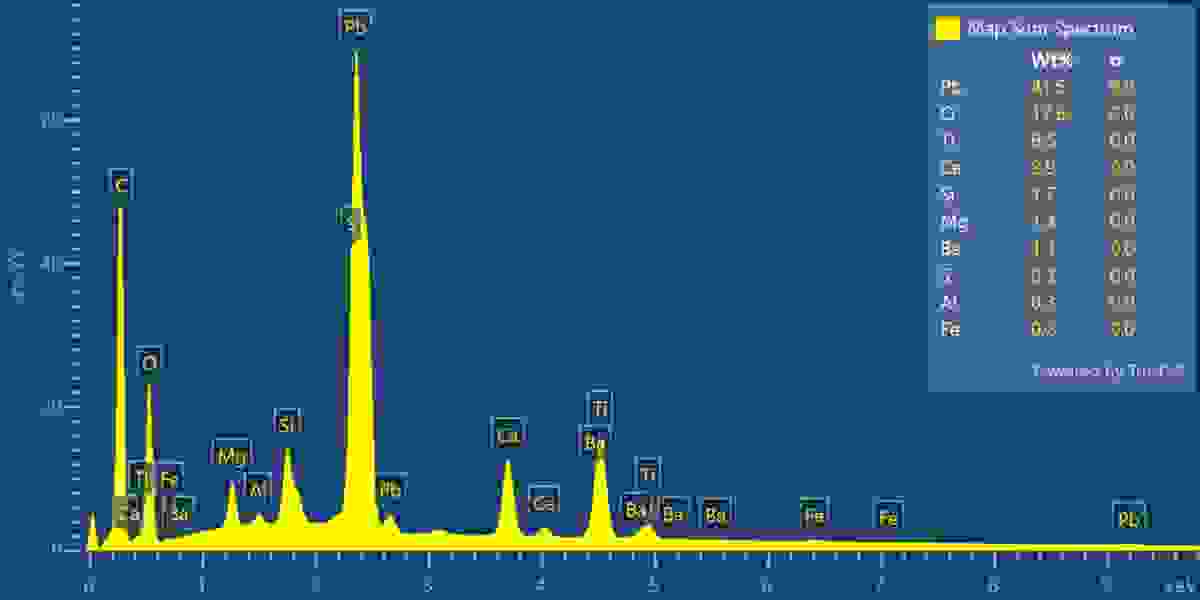
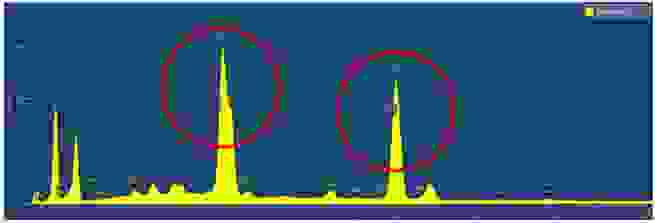
Now if we look at the sum spectrum for the mapping area, below, we can see there are two areas that can potentially cause issues, circled in red. The first (left) is the region where the peaks for Pb and S are located, and the second (right) is the region where Ti and Ba are located. In these regions, the peaks overlap each other, which is no issue with automatic identification and quantification, because the peaks are deconvolved to see the true counts for each element.
Unfortunately, because the standard mapping employed by all EDS systems uses energy ranges to generate maps, there can be issues if peaks are overlapping. So, because Pb and S peaks overlap, then their corresponding WI maps will show similar distributions and the same will be true for Ti and Ba. In such a situation, a novice user could never be 100% sure whether the Pb and S were in fact the same.
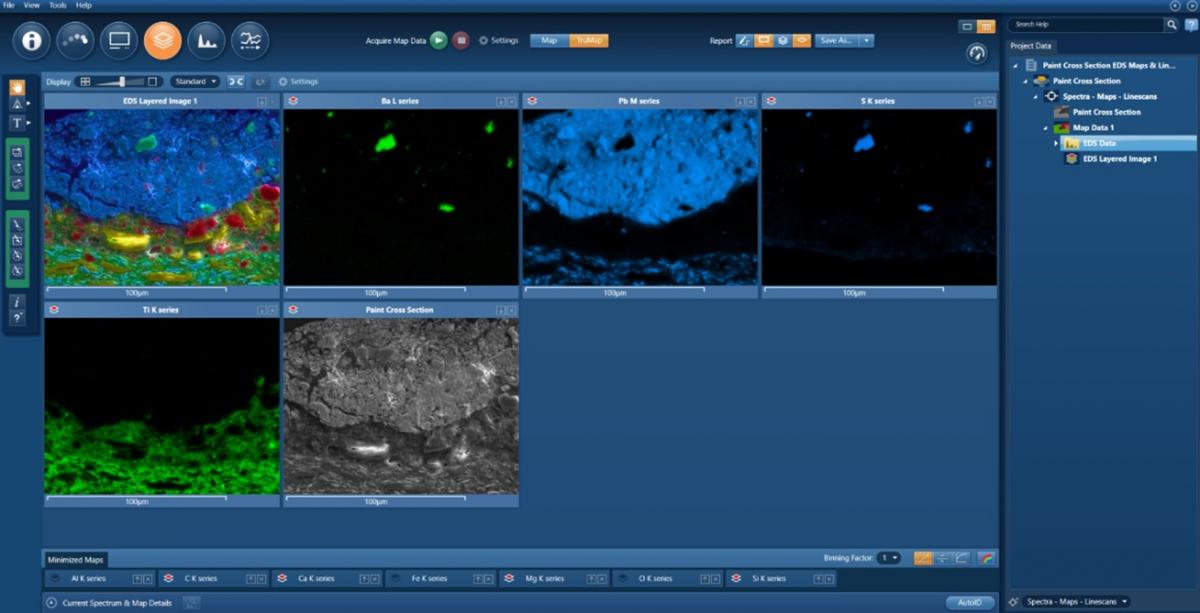
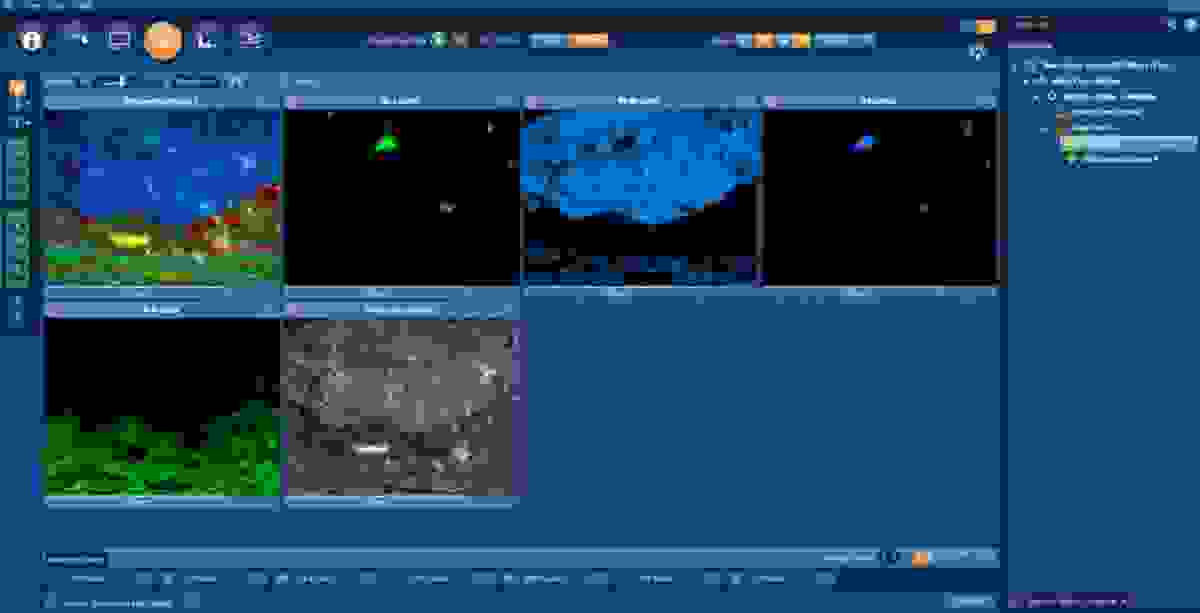
However, AZtecOne uses TruMap to eliminate this issue. TruMap generates element maps that correct for peak overlaps and remove any background anomalies. You can see that running TruMap on the same sample now shows a very different picture (below). Now you can see that the Pb and S distributions are very different, as are the distributions of Ti and Ba. In fact, now, Ba and S have similar distributions.
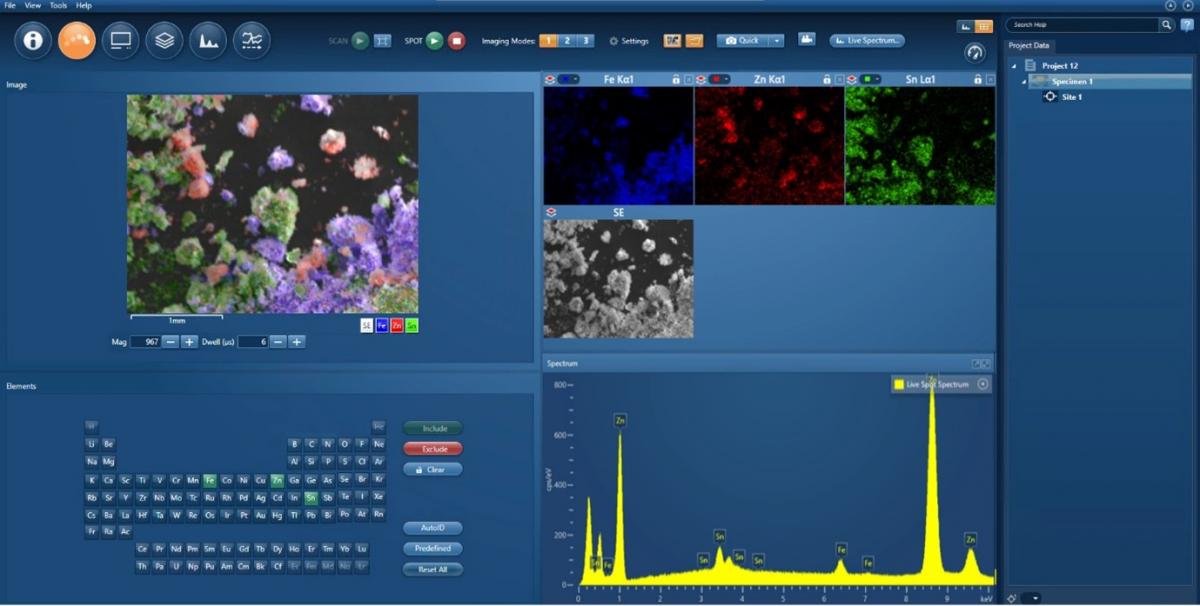
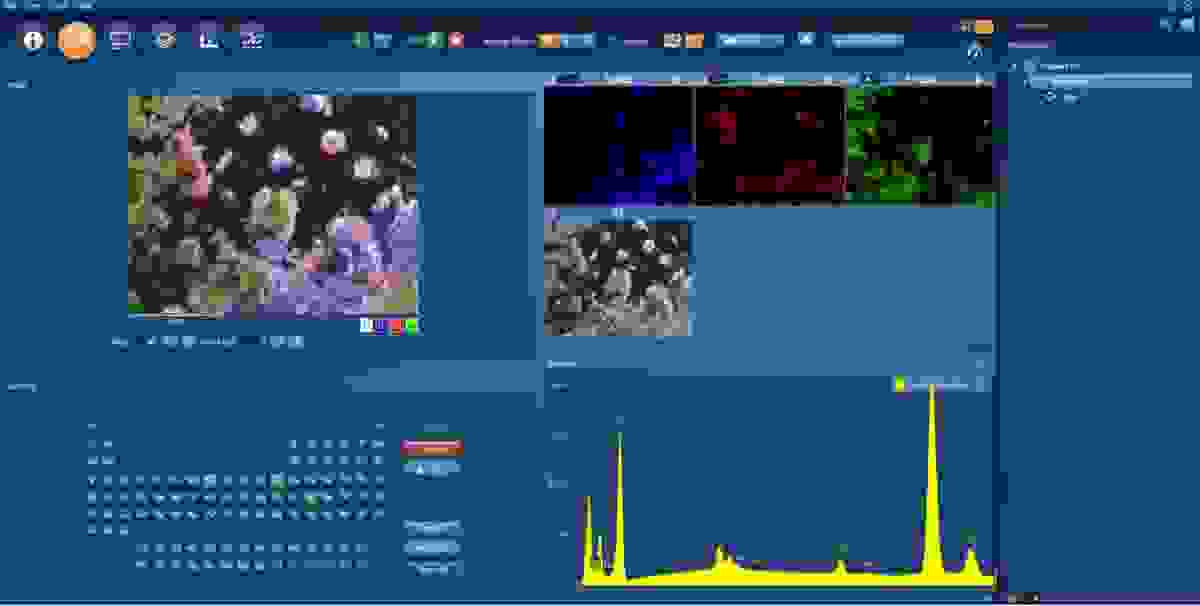
The simplified interface along with clever tools like Tru-Q and TruMap make the AZtecOne platform ideal for the inexperienced or infrequent EDS user. As new features are introduced into AZtecLive, they are also looked at, to see whether they can be of benefit to AZtecOne users. One such feature, is Live Chemical Imaging (LCI), which was introduced into the AZtecLive platform to take advantage of our large area SDDs.
LCI gives you the ability to investigate your sample while viewing live electron image, maps and spectrum – some examples of Live Chemical Imaging in action, can be found here. This was seen as an invaluable tool for the AZtecOne users and was introduced as a new functional step.
As the capabilities of TTMs have increased, so has their user base. Users with more technique knowledge and advanced application requirements have discovered that TTMs equipped with EDS are more than capable of satisfying their needs. TTMs are now commonplace in electron microscopy laboratories, where they’re used for sample screening and general analysis. As a results of this expansion into multi-user environments, we also see AZtecOne being installed alongside AZtecLive on general SEMs. Allowing users of varying experience to choose the software platform that best suits them.
There will be a comprehensive tutorial available on how to use the AZtecOne platform available from the Oxford Instruments website, where I will take you through the software step by step and explain how to get the best out of it.