Multimodal microscopy combines several microscopy modalities to visualise the same sample. This approach combines the advantages of different methods, creating datasets with structural, physical, and chemical information.
Preparing samples in a way that they can be imaged in different modalities, while tracking and preserving the same regions of interest, is a technical challenge that can be as fun as it is frustrating.
The samples are imaged using different microscopes, and the multimodal data need to be correlated, visualised, and analysed together, finally combining all the collected information.
As an epic microscopist’s adventure, multimodal microscopy is very similar to the hero’s journey trope. Both can be divided into 3 acts:
| Hero’s Journey acts ¹,² |
Microscopist’s Multimodal Journey acts |
| I. Departure – the call to adventure! |
I. Project design – select modalities! |
| II. Initiation – trial and quest |
II. Imaging – the trials of data collection |
| III. Return – hero returns with the boon |
III. Interpretation – combining and analysing the data |
Relate and The Third Act – the painless return of the hero
Just like Frodo’s journey to destroy the ring in the fires of Mount Doom, collecting all the multimodal data in the same sample can be a long and arduous odyssey. Upon the completion of the quest, Frodo’s rescue from without was being flown by giant eagles. What is the microscopist’s giant eagle that can make data interpretation a painless job?
Relate is a software package that is optimised for multimodal data analysis, while being easy to learn for new users. Data collected from different microscopes is imported and visualised in multi-layered 2D or 3D displays.
Figure 1. Loading and visualising a multi-layered dataset in Relate.
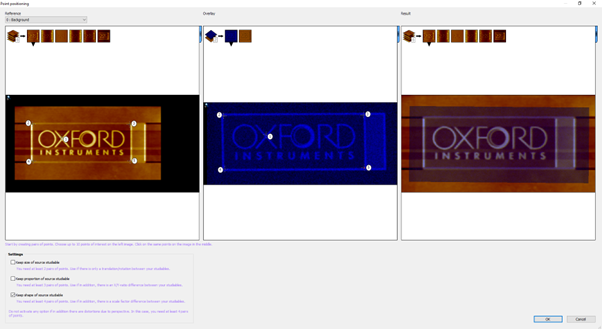
The correlation workflow uses image features for combining the matching datasets using an interactive interface.

Figure 2. Relate’s Point positioning dialog window updates the correlation results in real time.
The highly customisable visualisation tools are key for interpreting multimodal datasets. The overlayed data can be rendered as image composites with customisable display options. The data analysis tools for measuring and quantifying a wide range of parameters can be used across the different layers and easily exported.
Figure 3. Overlaying Atomic Force Microscopy (AFM) and Energy Dispersive X-ray Spectrometry (EDS) datasets with a 3D view study.
Relate makes correlation and data analysis workflows simple and reproducible. If you are interested in learning more about correlation and visualisation workflows, please register to the upcoming Relate tutorial.
References
- Joseph Campbell, The Hero with a Thousand Faces. Princeton: Princeton University Press, 2008 (3rd edition).
- https://tvtropes.org/pmwiki/pm...