Part of the Oxford Instruments Group
Expand
Bio-Imaging & Life Sciences
Using EDS for imaging ultrastructure: Colour EM​

EDS for imaging 

Ultrastructure can be imaged or enhanced using EDS. Our systems offer detector sensitivity for low kV analysis of native biological elements at high resolution in addition to the analysis of differential locations of stains and labels.  We offer large area detectors for fast data collection and windowless systems for the ultimate in detector sensitivity. 

  • X-ray mapping can be used in addition to greyscale micrographs to identify regions or structures of interest in biological samples, for example, lipid droplets in liver tissue stained with osmium.
  • Endogenous elements can be used to map ultrastructure in low contrast or cryo-specimens or combined with stains to enhance elemental contrast.
  • Stains assumed to co-localise (for example zinc-iodide-osmium) assumed to co-localise can demonstrate differential localisation within & between cells.
  • Stains, probes and immunolabels can be identified by composition, avoiding misidentification of labels.
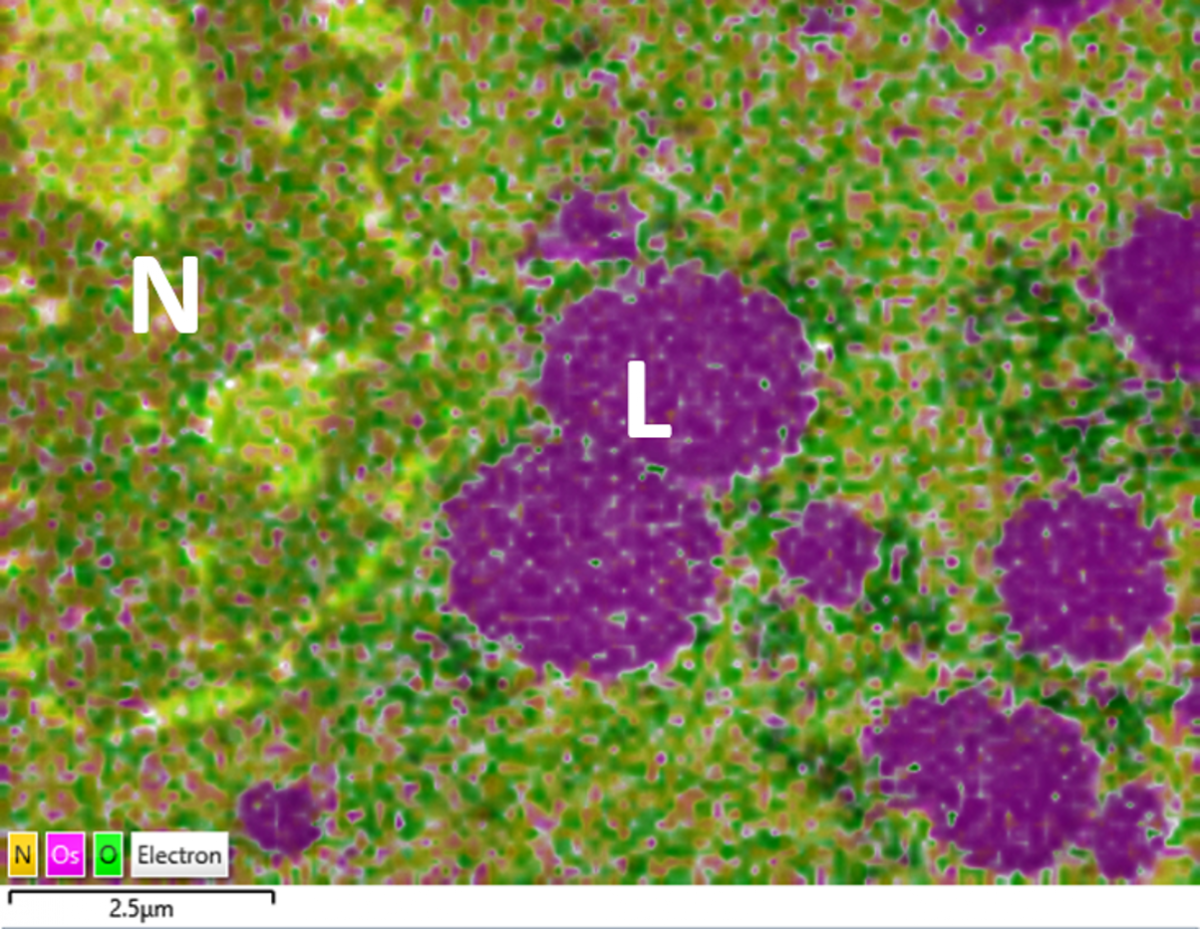
EDS layered map of a liver cell
*The above Image showing an EDS layered map of a liver cell, stained with osmium tetroxide, embedded in resin and sectioned at 100nm thickness. EDS data was collected in a scanning electron microscope at 4kV with an Ultim Extreme EDS detector and AZtec software. The EDS map shows lipid droplets (L) in a liver cell stained with osmium tetroxide (pink), immediately differentiating them from surrounding tissue and in particular the nucleus, which has a similar level of greyscale staining density. 
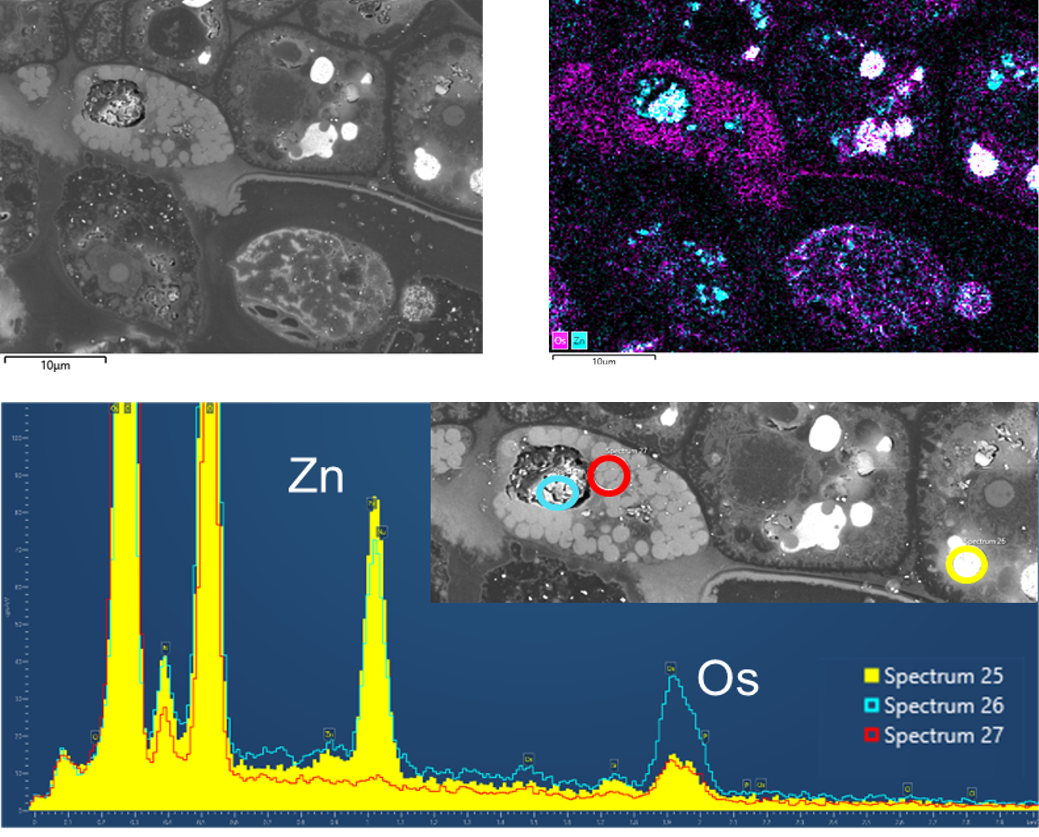
SEM EDS data of plant cells showing elemental distributions

Venus’ fly trap gland was stained with zinc-iodide-osmium. The sample is embedded in resin and coated with carbon. Images were collected from the sample block face using a scanning electron microscope at 5kV with the Ultim Extreme EDS detector and AZtec software. The EDS map shows a clear differentiation of zinc and osmium stains, supported by the different amounts of zinc and osmium as shown in the comparative spectra below. Data was collected at 6kV with an Ultim Extreme detector and AZtec software.

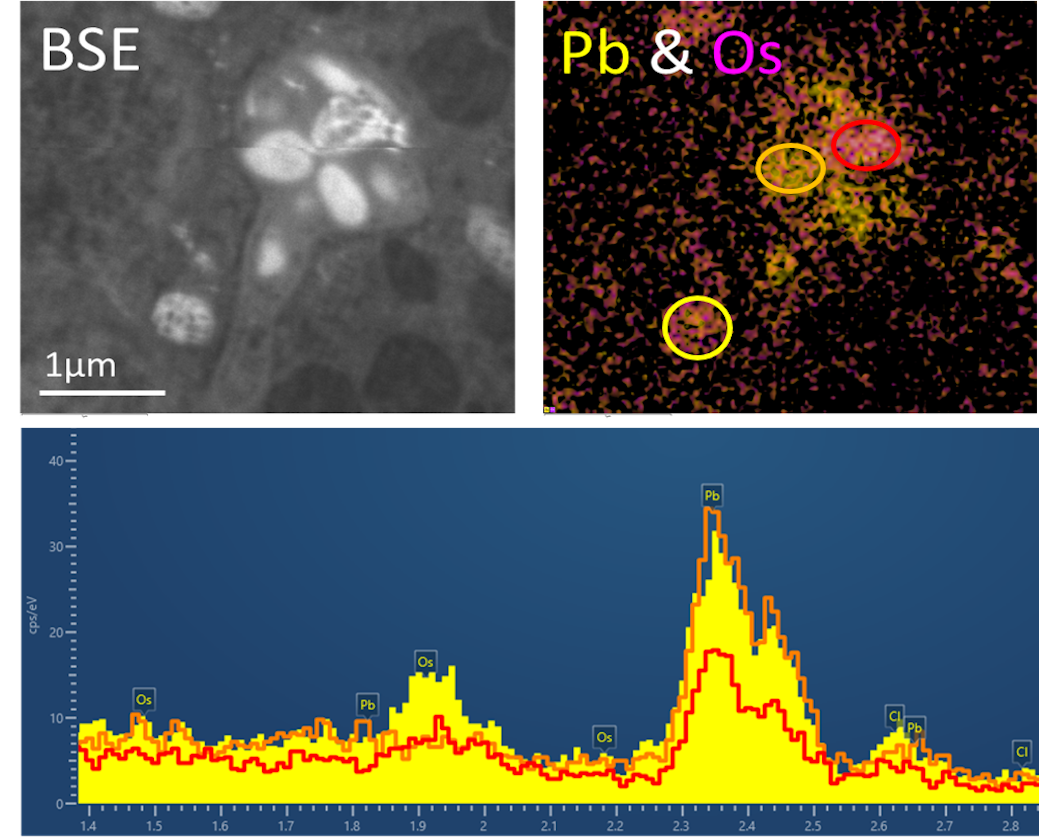
SEM EDS data of plant cell organelles showing elemental

EDS and electron images show differential lead and osmium staining within organelles inside a maize root cell (fixed, stained, embedded in resin, and sectioned at 100nm). The spectra at the bottom show differences in osmium and lead concentration within each of the areas highlighted on the right. Images were collected of sectioned material mounted onto a copper grid using a scanning electron microscope at 5kV with an Ultim Extreme EDS detector and AZtec software. 

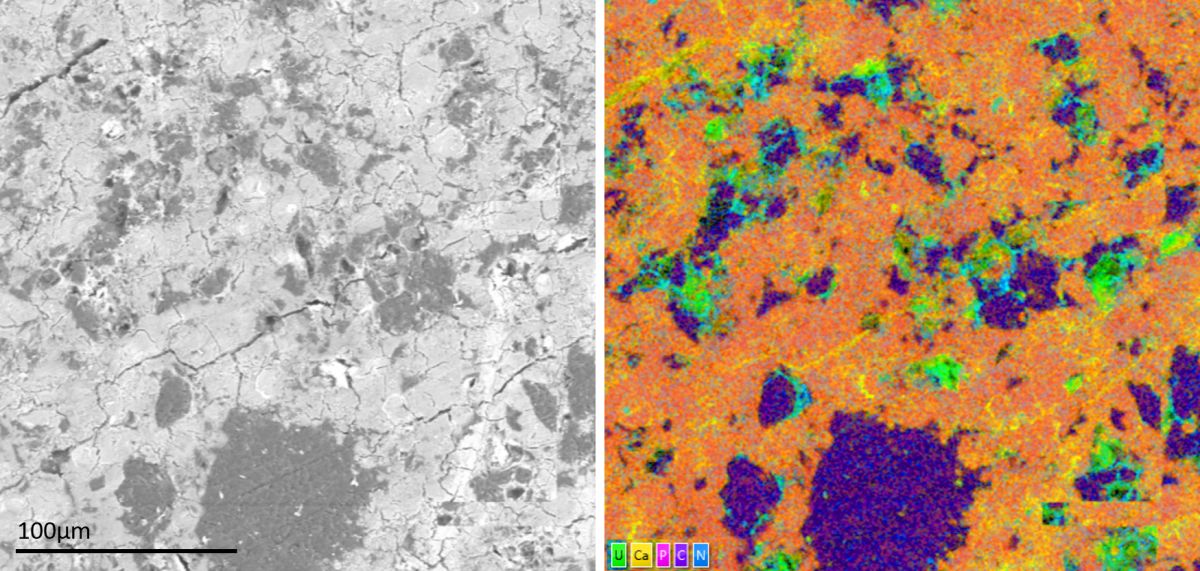
Colour electron microscopy 

*Sample courtesy of Zhidao Xia, Swansea University​

EDS provides a mechanism for colour electron microscopy. Incorporating compositional data to electron images enhances the amount of information in a single image. The data shown here shows cells distributed throughout the matrix of an hydroxyapatite bone implant. The backscattered electron image (left) shows some elemental contrast but it is not sufficient to easily identify the location of cells, even though they have been stained with uranyl acetate. EDS can be used as an imaging tool to facilitate the identification of structures within a sample, as shown in the bottom image of a layered EDS map. The cells, shown in green and light blue (uranium and nitrogen, respectively) immediately stand out from the calcium- (yellow) and phosphorous- (pink) rich implant.   

EDS on unstained samples

Elemental contrast can be used on unstained and cryo-samples to image cell features and obtain ultrastructural information. Unstained samples embedded in resin are shown below. There is very little in the way of contrast in the STEM images. Layered EDS maps show the distribution of elements in the cells and organelles, revealing ultrastructural features such as membranes within the chloroplast from the phosphorous x-ray signals. 

The above figure immediately shows plant cells imaged in a TEM using STEM. Plant cells in a TEM using STEM. Very little contrast can be seen in the electron images alone. EDS maps of the same regions were collected using the Ultim Max TLE and revealed ultrastructural details, including the cell nucleus (middle left) and the thylakoid membranes in a chloroplast (right). It is also possible to distinguish clusters of iron (pink) and calcium (blue) decorating the thylakoid membranes. 

Library

Webinar: Bringing EDS to Life
Blog: Tips & Tricks for Biological EDS

Key products