Tips and Tricks for Biological EDS
Biological energy dispersive X-ray spectrometry (EDS) is a growing field of interest but can be challenging for biologists new to this field. It was for me when I started to use this technique. I came from a background of biological electron microscopy where EDS was extremely niche, but the applications of EDS for biological samples have expanded exponentially since then. Developments in windowless detector technology have significantly increased sensitivity to light elements typical of biological samples and, combined with the ability to operate at low accelerating voltages in a scanning electron microscope (SEM), has resulted in exciting opportunities for biological EDS. Here are a few tips and tricks for getting started.
1. Flat Surfaces and ultra-thin sections
Samples with a pronounced 3D structure absorb x-rays generated on sides facing away from the detector, which sits to one side of the specimen chamber, resulting in a shadowing effect in x-ray maps and artefacts in the identification of elements. The best type of sample for EDS has a relatively flat surface. Some samples such as leaves have a naturally flat structure and can be analysed directly. Other samples require trimming to achieve a flat surface. Cells and internal tissue structures can be analysed by embedding them in resin and either trimming the resin block or cutting sections, which can be put either on a grid or onto an SEM stub. I prefer doing analysis on sections as I find them the most stable type of sample and they are compatible with both transmission electron microscopy (TEM) and SEM. Hydrated-frozen samples can also be prepared using cryo-ultramicrotomy or cryo-planing techniques.
2. Optimised sample preparation for your research questions
The signals obtained with EDS are influenced by the preparation of your sample. An addition of contrasting agents during fixation and embedding will affect the localisation of elements in your samples and the range of detected x-rays. Unstained and cryo-samples will provide a better analysis of native elemental localisation, whereas stained samples may provide structural and functional information about your sample. What elements are of interest for your analysis? Look at the x-ray energies for those elements. Does one of the stains (for example osmium) have similar x-ray energy to the element you are investigating? If so, can you eliminate it from your specimen preparation protocol or use an alternative stain?
Coating the sample is important for SEM-EDS analysis on biological samples as it provides conductivity to the sample, reducing the amount of specimen charging (build-up of negative charge that distorts the beam and electron signals). Resin embedded sections can be mounted directly onto stubs and will not require coating when using low accelerating voltages. Alternative substrates can be coated in carbon before sections are placed onto them. Blocks of resin-embedded tissue or dried samples should be coated, preferably with 5-20nm of carbon (depending on the sample). It is important to make the resin block as small as possible. Conducive epoxy or carbon tape can be used to attach your block to a specimen stub. Coating the edges of your sample or resin block with silver paint will also help with conductivity. Carbon coating absorbs some lower energy x-rays such as those emitted by nitrogen. If these elements are critical to your analysis use another type of coating or alternative specimen preparation method such as sectioning.
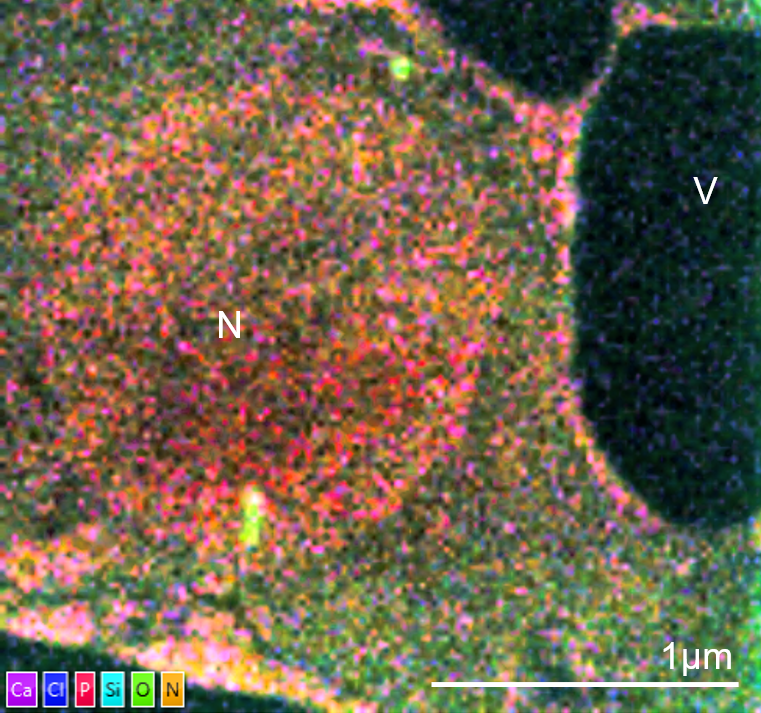
TEM-EDS image of an unstained cell from Arabidopsis thaliana. The cell is from a leaf vascular bundle. The sample was fixed in aldehydes, dehydrated and embedded in LR white. No pre- or post-embedding staining was used. The elemental map shows ultrastructural information from the cell without the need for stain with the nucleus (N) and vacuoles (V) defined clearly. The image was captured using an Ultim Max TLE detector and AZtecTEM software. The TEM was operated at 200kV in STEM mode with spot size of 2. Sample was tilted 20° towards the EDS detector. The elemental map was collected at a resolution of 1024 pixels with a 50µs dwell time and process time 5.
3. Microscope conditions
Microscope conditions play an important role in any form of electron microscopy and a good starting point is to use conditions that are compatible with your sample type. Transmission electron microscopy (TEM)-EDS systems require the ability to do scanning TEM (STEM) imaging. Tilting the sample towards your EDS detector by 20 degrees makes a significant difference in how many x-rays you collect from the sample. The dosage of the beam on your sample will affect the signal you obtain but higher dosages can also damage or destroy your samples. This is particularly important for cryo-EM.
Scanning electron microscopy (SEM) of biological samples typically uses a relatively low accelerating voltage (5kV or less) to reduce sample damage and increase image resolution. This is because accelerating voltage (kV) directly affects the volume of the specimen and electron beam interaction. The higher your kV, the further into your sample electrons will penetrate and the larger the volume from which your electron and x-ray signals are produced. A corresponding reduction in kV will reduce the interaction volume and improve spatial resolution of your signal. To maximise resolution and signal to noise for SEM- EDS analysis for all accelerating voltages you should use the working distance (this is the distance between your sample and the objective lens pole piece) recommended by your EDS supplier. For example, the Ultim Extreme will often have a recommended microscope working distance of 10mm.
X-ray generation is dependent on elements in your sample as well as your kV. A good rule of thumb is to use an accelerating voltage that is at least 2.5 times the energy of the x-ray emission you are trying to detect. This is usually only an issue for SEM-EDS as TEM accelerating voltages are generally much higher. Increasing beam current or using a larger condenser aperture will help to increase the number of x-rays being generated at low kVs, registered as X-ray counts. The range of accelerating voltages that you require will influence your choice of detector. The best analysis of biological specimens is often achieved using a low accelerating voltage, an application where the improved sensitivity of the Ultim Extreme and it’s high solid angle (this is the field of view, increasing the size and shape of an EDS detector and reducing the distance the detector is to the sample improves its solid angle and the amount of x-rays that can be detected from the sample) is a huge advantage. For work above 7kV the Ultim Max range of detectors is required.
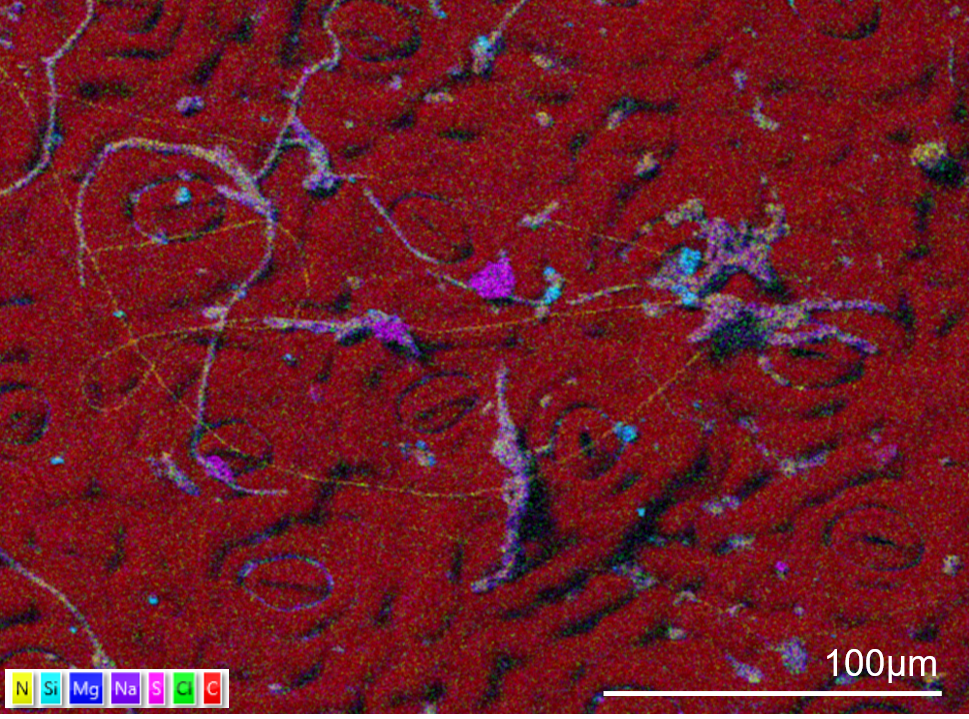
The surface of a holly leaf showing sulphur (pink) and silicon (blue) contamination. To avoid washing the contamination off the surface the sample was not fixed. The sample has been gently dried and mounted onto an aluminium stub. The edges of the sample were painted with silver paint and the sample coated in 20nm of carbon. The sample was imaged using an Ultim Extreme detector in an SEM in high resolution mode and with an accelerating voltage of 5kV with 1nA current. The map took 10 minutes to collect using a resolution of 1024 pixels and a pixel dwell time of 50µs and process time 4.
4. Take your time
It is possible to collect data with very low x-ray count rates by collecting x-rays for longer. Use parameters such as pixel dwell time, image and map resolutions, and process times to optimise your imaging or analysis conditions. You may want a lot of fast images to quickly build up a map of your sample and leave that running for 10-60 minutes (or longer) or you could focus on obtaining 2 or 3 scans of the area with long dwell times. Do you need to collect an x-ray map of the whole region? It might be that you just need a smaller area in the context of a wider area. I find it beneficial with biological samples to image at higher magnifications where possible as I get better maps of the elements I am analysing or using a lower magnification and collecting data from a small region within my field of view.
When doing any prolonged analysis, it is important that you reduce sample drift as much as possible. AZtec has a feature that will allow you to correct for some sample drift called Autolock. I have found this an invaluable feature for biological samples, even for those that appear stable under the electron beam.
I hope this has provided a few pointers to get people started. Are there any tips or tricks that you have discovered? Is there anything here that you would like more information about? Comment below to get in touch with our team, and browse our application notes for more examples of using EDS with different types of samples.