Correlative Analysis: Learning to See More
“It was six men of Indostan,
To learning much inclined,
Who went to see the Elephant
(Though all of them were blind),
That each by observation
Might satisfy his mind.”
- Blind Men and the Elephant, John Godfrey Saxe (1816-1887)
I’m sure many of you are familiar with the story, it is an old Indian fable about a group of blind men who have never encountered an elephant and who seek to understand what an elephant is through touch alone. As each man feels a different part (side, tusk, trunk, knee, ear and tail) the nature of the elephant is at once determined to be like a wall, a spear, a snake, a tree, a fan and a rope. Once the men start to exchange their knowledge of the elephant, they remain devoted to their narrow experience and the scene degenerates quickly into arguments and, depending on which version of the tale you read, to violence.
The original parable is thought to be at least 2,500 years old and it has been told many times in many variations over the intervening years. In the John Godfrey Saxe poem, the elephant is used as a metaphor for God, but while watching our recent webinar on Imaging the Natural World it sprang to mind as being analogous to microscopy.
The webinar showed the images below, acquired from the surface of a leaf collected from the botanic garden in Padua, Italy.
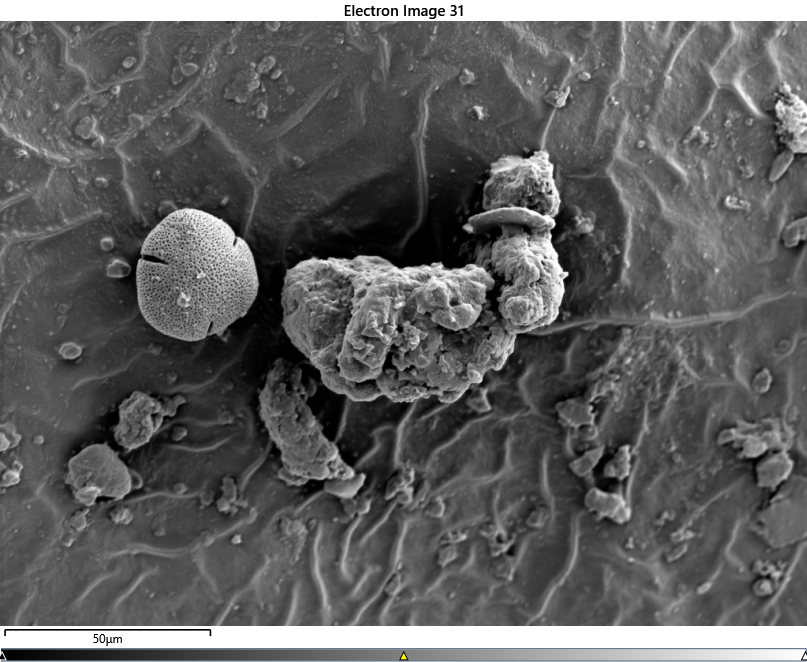
Electron Image
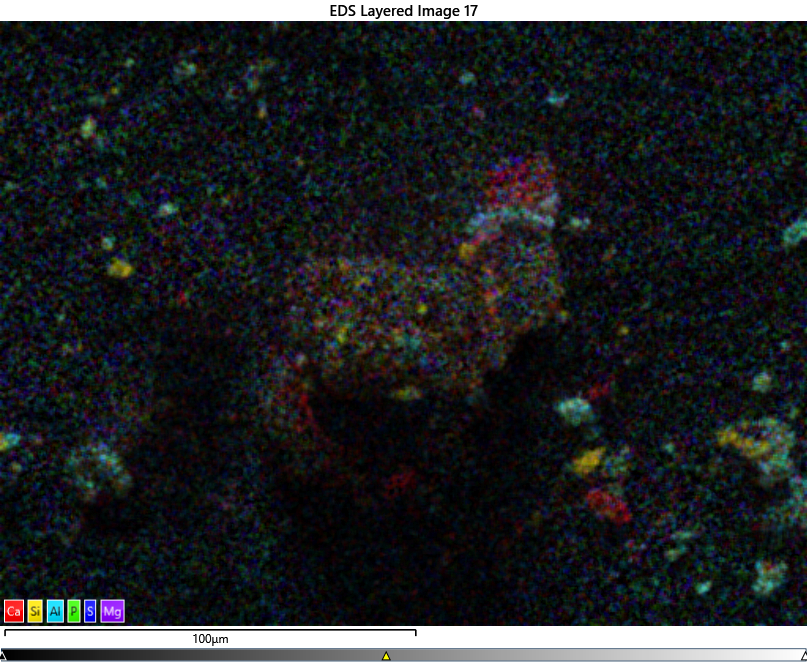
EDS Map showing Ca, Si, Al, P, S & Mg distribution
The centre-left of the electron image shows a single grain of pollen clearly visible, yet for all the richness of data added by EDS the pollen grain is invisible in the EDS map since its chemical composition is identical to the substrate - the leaf
Neither of these images show the true nature of the leaf but each one adds a layer of information acquired from a different perspective, using different techniques with their own inherent strengths and weaknesses. Armed with both perspectives it is possible to edge closer to a real understanding of the sample.
Those simple images made me reflect on one of the joys of working at Oxford Instruments NanoAnalysis. Not only do I have the privilege of rubbing shoulders with experts in EDS and EBSD but also the chance to spend time learning from equally knowledgeable colleagues from our sister companies such as Asylum Research, the Atomic Force Microscopy (AFM) business within Oxford Instruments.
While SEM and AFM are surface analysis techniques, they both operate in fundamentally different ways and thus each one yields different information from a sample – one is feeling the elephant’s knee and the other its ear. Rather than probing the sample with an electron beam the AFM feels the surface with a physical probe driven by piezoelectric elements. AFM measurements can be acquired routinely at sub-nanometre resolution and provide quantifiable information on surface topography, but it is the ability of the AFM to measure material properties that truly adds a new dimension to understanding a sample.
Through clever measurements of force, current and sample response to tip bias the AFM can map elastic properties, electrostatic force, surface potential, piezoelectric response and more. The example below shows two dramatically different views of the same duplex steel sample.
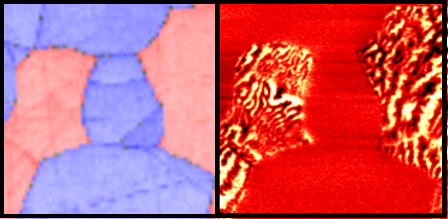
Left: EBSD phase map & band contrast with ferrite (red) and austenite (blue) phases
Right: AFM magnetic response
While the EBSD data can clearly identify boundaries between different grains of the same phase the AFM shows the magnetic domains within the ferrite phase.
It’s a common goal to improve the performance of a material and delivering this can involve following the chain of cause-and-effect all the way back to the way the material is processed.
Electron Microscopy techniques such as EDS and EBSD deliver a wealth of information about the structure of a sample including composition, phase distribution, grain size and grain orientation.
The ability to directly measure material properties makes AFM a hugely valuable tool when trying to understand how this material structure will then affect its ultimate performance.
Every new technique that provides complementary data allows us to see our sample differently. I would be fascinated to hear about any correlative successes or failures you have had, be they with SEM, AFM or any other techniques. Comment below to let us know how it went for you!
In a modern inversion of the elephant parable six blind elephants discuss the nature of man and after much debate they decide that they need to learn from direct experience. The first blind elephant feels the man and declares “Men are flat” after which the other elephants also feel the man and they all agree.
I will leave the subject of beam-induced sample damage to another day!