Following on from my last blog post, discussing why different styles of wavelength dispersive spectrometer give different qualities of result, I wanted to highlight the main reasons to add an Oxford Instruments Wave spectrometer to your SEM. In this blog, I outline what I consider to be the five primary reasons for choosing a Wave spectrometer. These range from the increased analytical capability it brings to the analytical SEM, through to the ease of use of the new AZtecWave software.
1. High spectral resolution
First of all, the key advantage Wavelength Dispersive Spectrometry (WDS, WDX) brings to the SEM is a higher spectral resolution than can be achieved using other SEM-based methods for determining elemental composition, for example, Energy Dispersive Spectrometry (EDS, EDX, EDXS). This makes it possible to separate X-ray peaks that overlap in the EDS spectrum (see Fig. 1). Being able to separate closely occurring X-ray peaks is important for making accurate quantitative measurements, as well as correctly identifying the presence of elements, especially if they are present in low concentrations.
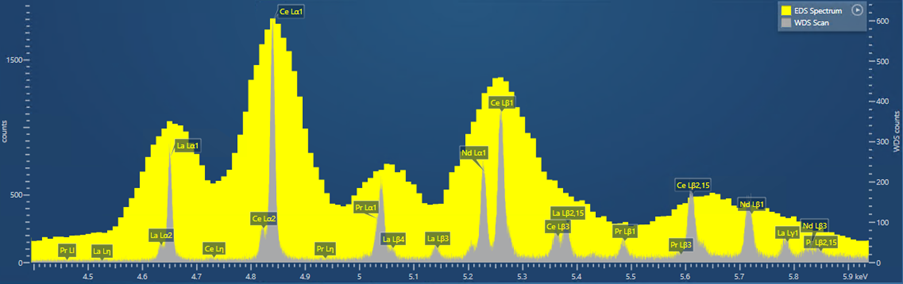
Figure 1. Spectrum collected of closely occurring Rare Earth Element (REE) X-ray peaks from the mineral monazite, showing the higher resolution and peak separation that can be achieved using WDS (grey) in comparison to EDS (yellow).
Out of all the WDS solutions available for the SEM, the Oxford Instruments Wave spectrometer gives the best spectral resolution (e.g. Si Kα = <2 eV, Fe Kα = <25 eV). This is because the Wave spectrometer is the only WDS solution available for the SEM with a Rowland circle geometry - the same design of spectrometer as used on electron microprobes (i.e. EPMA). You can learn more on why the Rowland circle geometry gives the best spectral resolution, by referring to my previous blog post.
2. Low detection limits
The high spectral resolution of the Wave spectrometer means higher peak to background ratios, resulting in lower detection limits for elements than can be achieved using EDS. Using the Wave spectrometer detection limits of <100 ppm can be achieved for many elements (e.g. Si Kα = 9 ppm, Fe Kα = 15 ppm), whereas for EDS detection limits are closer to 1000 ppm. This makes the Wave spectrometer capable of detecting and accurately quantifying trace elements. Therefore, the Wave spectrometer is a useful addition to the SEM for numerous applications where it is necessary to identify and measure trace elements, for example, identifying the presence and concentrations of a dopant in semiconductor samples.
3. Relative insensitivity to sample positioning and height
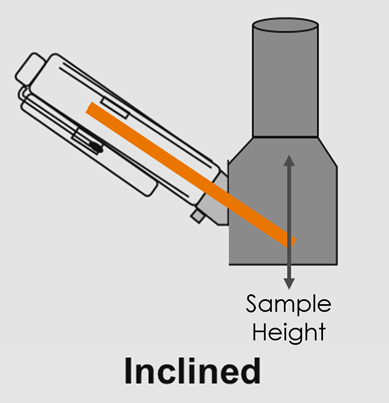
Another advantage is achieved by mounting the Wave spectrometer on the SEM column at an inclined geometry (see Fig. 2). This orientation essentially broadens the plane of the Rowland circle, so WDS measurements made using the Wave spectrometer are less sensitive to sample positioning and height (to approximately ±0.5 mm). This makes sample setup relatively quick and easy, as time doesn’t have to be invested in ensuring the surface of the sample is at exactly the right height/position to a high degree of accuracy. This is much more optimal for analysis in a multi- purpose/use SEM. Both parallel beam WD spectrometers with capillary optics, and electron microprobe WD spectrometers that are mounted vertically, are much more sensitive to sample position.

Figure 2. Schematic showing the inclined angle of the Wave spectrometer on an SEM column. The approximate position of the Rowland circle is highlighted in orange and the broadening of the plane of the Rowland circle at the vertically positioned sample is demonstrated (in this orientation the Rowland circle is being viewed from the side).
4. Integration with Energy Dispersive Spectrometry (EDS)
A major difference between WDS and EDS is that WDS measures one X-ray energy (i.e. element-line) at a time, whereas EDS collects the full energy spectrum simultaneously. This inherently makes WDS a slower technique in comparison to EDS, particularly when only using one WD spectrometer. Our solution to make compositional analysis using SEM-WDS time effective is to combine it with EDS.
The Wave spectrometer and AZtecWave are fully integrated with our EDS detectors, meaning that WDS and EDS analysis can be combined. This makes for a powerful and highly efficient system for compositional analysis in the SEM. Major-minor elements, and those unaffected by peak overlaps, can be accurately measured and quantified using our EDS detectors and the Tru-Q data processing available in AZtecLive. This allows the Wave spectrometer to be efficiently utilised when necessary, either for the quantification of trace elements, or to resolve and quantify elements affected by peak overlaps. The AZtecWave software enables EDS and WDS analysis to be conducted at the same time and the data brought together to give highly accurate, quantitative compositional results for a sample (e.g. where the major elements have been measured via EDS and the trace elements via WDS).
5. Ease of use
Lastly, the Wave spectrometer can now be setup and run through the latest AZtec software, and AZtecWave has been designed with ease of use in mind. There are guided workflows for both set up and analysis, and step-by-step instructions guide the analyst through each stage (see Fig. 3).
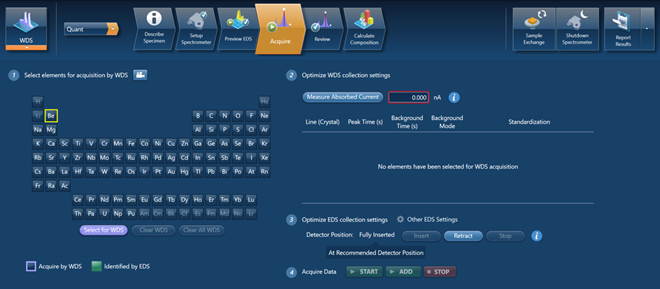
Figure 3. Part of the AZtecWave guided workflow for setting up combined WDS-EDS quantitative measurements, showing the step-by-step instructions in the user interface and presence of embedded help videos (see camera icon next to point 1).
Unique software technology, which uses the EDS input and SEM system information, aids and informs the setup of the WDS acquisition. This inbuilt technology enables AZtecWave to make automatic selections where possible (e.g. of the most appropriate X-ray line, diffracting crystal, background positions) and to give appropriate recommendations for collection settings (e.g. WDS peak and background counting times, EDS insertion position). Feedback is also given in the software, prior to the user pressing start, as to the quality of WDS data that can be expected using the currently selected settings. The helps guarantee excellent results for users of all experience levels, and in the shortest possible times.
And that concludes my five key reasons for choosing to add a Wave spectrometer to an SEM. If you would like to know more, or are interested in getting a quote, please get in touch with us.