Products
FIB-SEM
Nanomanipulators
OmniProbeOmniProbe CryoSoftware
AZtec3DAZtecFeatureAZtec LayerProbeTEM
Hardware
EDSUltim MaxXplore for TEMImaging
TEM CamerasSoftware
AZtecTEM
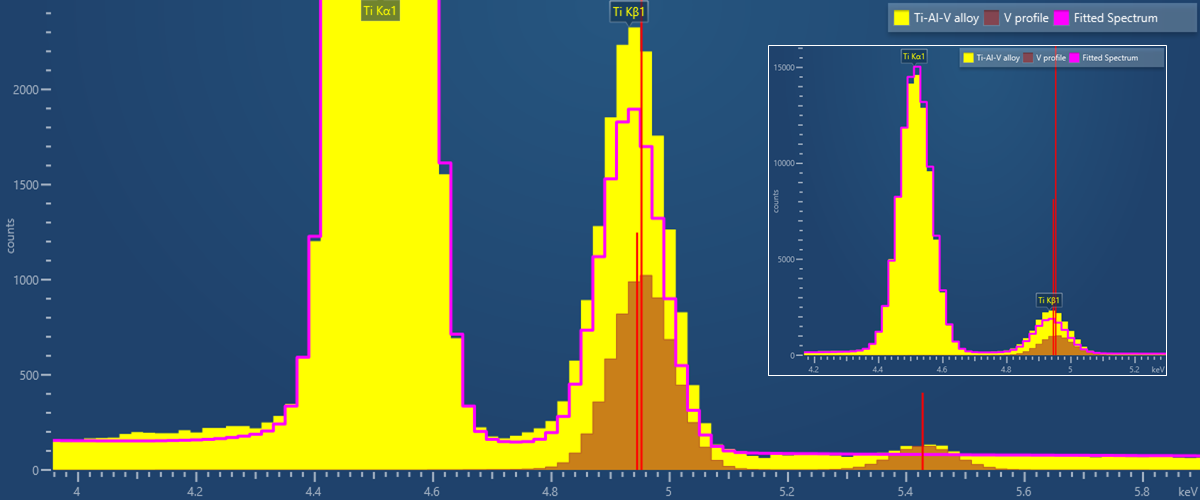
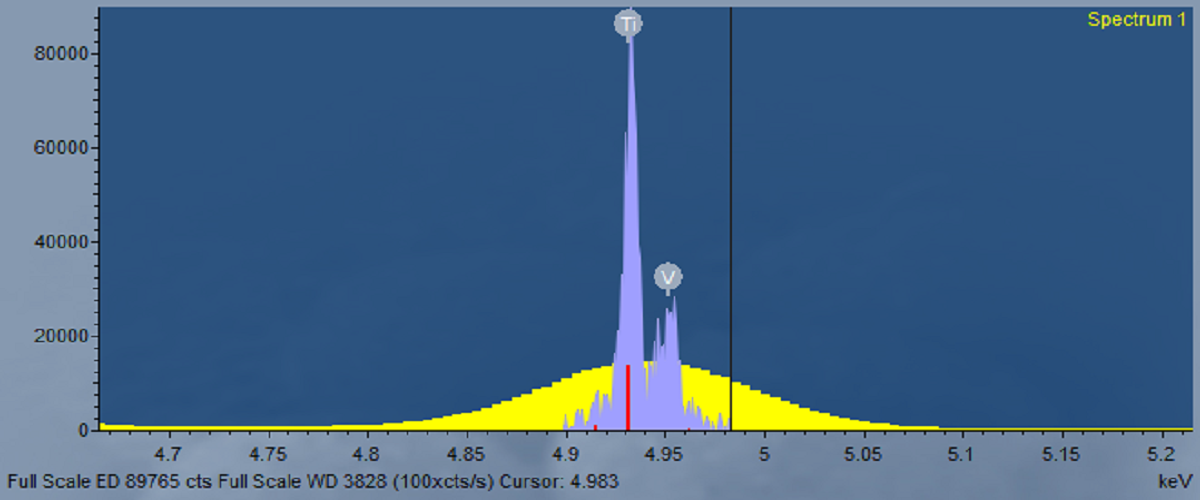
The elemental composition and the segregation of different elements in metals can greatly influence the physical metals properties and behaviour. AZtecWave can be used to measure and quantify light and trace elements in metals, which are more challenging to accurately quantify with EDS. This can be carried out alongside the analysis of major elements (via EDS, or WDS). Some application examples include:
Here we present some data collected from a stainless steel with published compositions using AZtecWave. These measurements were made with an Ultim Max 100 mm2 EDS detector and a Wave WDS spectrometer. Combined EDS-WDS analysis was carried out using an accelerating voltage of 20kV. The major constituent elements in the stainless steel were measured by EDS, and the concentrations of the trace constituents: Co and P, were measured by WDS. As shown in the data table, there is a good match between the measured and published compositions.
Element | Fe/Cr/Ni | Si | Mn | P | Co | Ti | Total |
Published reference values (wt. %) | - | 0.59 | 0.90 | 0.011 | 0.022 | 0.30 | - |
Technique used | EDS | EDS | EDS | WDS | WDS | EDS | - |
Average (wt.%) | 0.614 | 0.961 | 0.009 | 0.021 | 0.303 | 101.036 | |
1σ | 0.027 | 0.077 | 0.002 | 0.003 | 0.262 | 0.464 | |
# analysis points | 6 | 6 | 6 | 4 | 6 | 6 |
Determining the minor and trace element concentrations in minerals and rocks is important in the fields of geological research, planetary research, natural hazard monitoring, mineral exploration, and mining. Minor and trace elements present in rocks and minerals can give information on their origin, evolution, age, and whether they are economically important. AZtecWave can be used to measure elements that are present in concentrations that are too low to measure accurately using EDS, or where overlaps between X-ray energy lines for different elements exist. Some specific examples include:
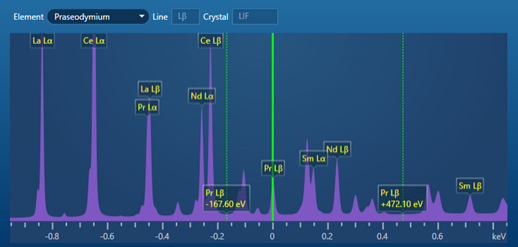
A simulated WDS spectrum for the mineral monazite, showing the high occurrence of peak line overlaps amongst the rare earth elements. This particular window shows the automatic line and background position selection, in this case for Praseodymium, available in AZtecWave. In this instance, AZtecWave has automatically selected to measure the Pr Lβ peak to avoid the inaccuracies caused by the overlap of the La Lβ peak on the Pr Lα peak.
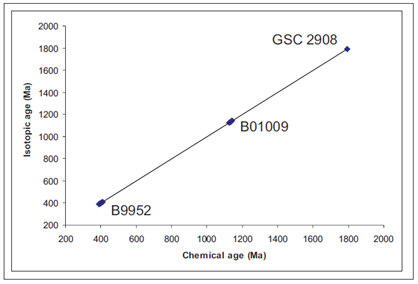
An example of using SEM-WDS to determine the age of an unknown monazite grain is presented here. U, Th and Pb concentrations were measured using a Wave WDS spectrometer. The analysis was conducted using an accelerating voltage of 20kV and a beam current of 49.5 nA. The overall analytical time was just over 2 hours, and this time is primarily made up of long peak and background counting times on U, which is in low concentration <0.01 wt.% in this particular monazite grain. The WDS counting times and results are shown in the below data table.
Element | Signal Type | Line | WDS Peak Live Time (s) | Background Live Time (s) (x2) | Wt% | Wt% Sigma | Standard |
Pb | WDS | Mα | 25 | 15 | 0.225 | 0.032 | MAC 9613 - PbTe |
Th | WDS | Mα | 5 | 5 | 3.345 | 0.117 | Block E - Th |
U | WDS | Mβ | 2885 | 2510 | 0.0029 | 0.0022 | Block E - Brannerite |
These results, specifically the measured Pb concentrations, yield an age of 1385 Ma (i.e., million years old) for this particular monazite grain, when using the equation of Montel et al. (1996). Thus demonstrating that U-Th-Pb age dating of monazite is possible with the new generation Wave WDS spectrometer and AZtecWave.
In the development and manufacturing of key components accurate compositional information is required, at a confidence level that cannot be achieved with EDS analysis alone. Some specific examples, where WDS provides the sensitivity and resolution required, include:
To learn more on how to use SEM-based Wavelength Dispersive Spectroscopy (WDS) to measure highly doped semiconductor layers, click here.
In the development of new materials for energy generation and storage, and in the production and maintenance of components, elemental compositions need to be determined with a high level of accuracy. This information goes on to inform future directions, and to ensure quality control and safety. Some specific examples, where WDS can achieve the degree of accuracy required, include:
Obtaining reliable and reproducible forensic evidence is critical to ensure it can undergo scrutiny in a court of law. Composition information is required on a wide range of forensics samples, from gunshot residue, to soil and minerals. This information can be obtained non-destructively using a SEM and X-ray microanalysis techniques (e.g., EDS, WDS). When key elements are present in low concentrations and EDS cannot produce an accurate enough result, or there is uncertainty over the presence of an element, WDS can provide the detection levels (<100ppm for many elements) required.
Here we present some data collected from glass of known composition using AZtecWave. These measurements were made using an Ultim Max 100 mm2 EDS detector, combined with a Max+ interface, and a WaveWDS spectrometer. The combined EDS-WDS analysis was carried out using an accelerating voltage of 20kV and a beam current of 82 nA. The minor/trace element (Mg, S, Ti, Fe, As and Ba) compositions were measured using WDS, and the major elements were determined by EDS. Known pure elements and simple compounds were measured as WDS standards prior to the quantitative analysis of the glass sample. The in-built, factory standards, provided in the AZtec software, were used for the EDS. As demonstrated in the below table, a good match is observed between the measured and published compositions.
Element | O | Na | Mg | Al | Si | S | K | Ca | Ti | Fe | As | Ba | Total |
Glass reference (wt. %) | 46.1 | 9.44 | 0.16 | 1.46 | 33.22 | 0.05 | 1.67 | 7.64 | 0.008 | 0.03 | 0.02 | 0.11 | 99.9 |
Technique | Cal. | EDS | WDS | EDS | EDS | WDS | EDS | EDS | WDS | WDS | WDS | WDS | - |
WDS peak live time (s) | 10 | 30 | 150 | 150 | 150 | 50 | |||||||
Average (wt. %) | 46.02 | 8.86 | 0.154 | 1.51 | 33.46 | 0.033 | 1.58 | 7.43 | 0.008 | 0.028 | 0.020 | 0.085 | 99.2 |
1σ | 0.08 | 0.09 | 0.004 | 0.03 | 0.06 | 0.002 | 0.01 | 0.07 | 0.001 | 0.001 | 0.001 | 0.011 | 0.2 |
WDS can be used for environmental studies when it is required to precisely and accurately measure small concentration of contaminants that could be introduced into biological systems after environmental disasters, such as oil spills.
Testing for the possible incorporation of Fe2+ ions in the crystalline structure of coralline algae after the world’s biggest mining disaster, which spilled up to 60 million m3 of ore tailing in Brazilian protected coastal areas. Measurements were performed using WDS due to better sensitivity and precision. WDS is an essential tool for the measurement of small amounts of contaminants in biological samples. The research can determine whether the contaminant ions can be trapped inside the crystalline structure.
Download this application note to learn: