One of the first steps when we analyse a sample in the SEM is to find the area of interest on the sample. Traditionally we would do this by navigating using the electron image trying to identify reference markers or easily identifiable features.
Early on during the development of the AZtec software there was added functionality to make it easy to use previous data to relocate to an area for continuing the analysis, potentially on a different instrument with more or better analytical tools available.
The next step is to extend this functionality and use not just existing data as reference for the SEM analysis but to use images from other sources, such as optical images or schematics of the sample. If the position of identifiable features on the image is correlated with the SEM stage positions, it is possible to use the image to position the SEM stage and thereby easily navigate to the features of interest. This approach will in a lot of situations save time and it is slowly becoming the normal way of working, especially when instruments are being used via remote access, where it might not always be possible to directly see everything as it is happening on the system.
The video below shows how the Image Registration in AZtec can be used for positioning the sample based on either existing data or imported images.
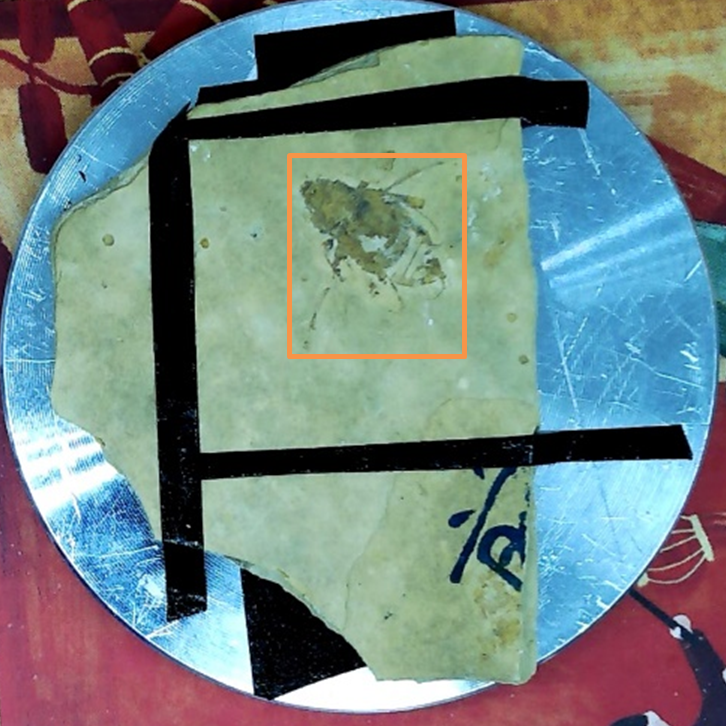
A typical problem where it can be very useful to use an optical image as reference would be, if large features must be fully covered during the analysis. On the SEM it can often be difficult to see the entire feature within a single field of view, thereby making it difficult to setup the analysis areas correctly. As example the beetle shown on Figure 1, where we want to define the area to that the entire beetle is covered during automated EDS analysis. Without using the bigger picture, it can be very difficult to position the SEM stage correctly so that the analysis covers the desired area, often resulting in features not being fully covered during the analysis. Using a photo of the sample makes this a much easier and faster process.
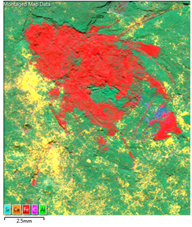
Figure 1 – To the left, photo of beetle fossil sample with the area of interest is marked by the orange rectangle and to the right the acquired chemical map.
As analysts we face the same problem when trying to use information from other sources to find the correct location on the sample. It doesn’t really matter if we are trying to position the sample in order to ensure that same area is analysed with different techniques or if we are using existing knowledge about the sample to ensure that the correct locations on the sample are analysed.
In all cases the Image Registration functionality in AZtec can help to ensure that the analysis is done in the correct sample locations. Given the fluctuating global restrictions, this image registration functionality allows users to be confident that they are imaging the areas of interest despite having to access and work remotely with their SEM.
AZtec has many features, like our image registration functionality, that make remote SEM-analysis easier, and there are many actions that users can take to have the best chance at success when doing remote working. One of our in-house experts, spoke in depth on the subject in a recent blog Dealing with the ‘new normal’ – remote SEM operation and analysis. Read the full article now to maximise your time and results.