Live chemical imaging is still a pretty new idea. All these videos of samples moving and X-ray maps keeping pace are very interesting, but how is this new technique improving on the processes of the past? I had an example, this week, which would be of interest to all of you who work with unfamiliar samples where you don’t know exactly what to look for.
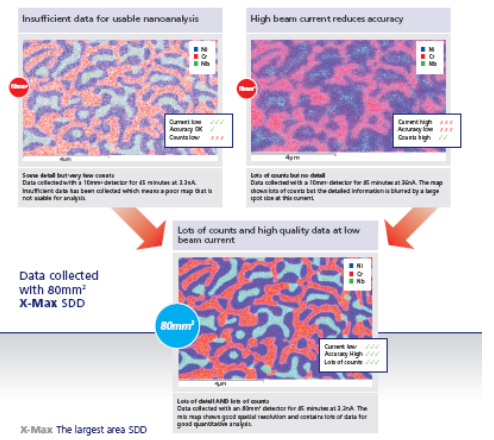
This sample below, an alloy used to make fibre glass spinner bowls, has been in my possession for over 20 years. We have used it to explain the need for low kV and high sensitivity detectors many times over. Some of you will remember this from the launch of the first large area SDD detector, X-Max, in 2008.
The sample has a micro-structure of nano-scale Cr-carbide and Nb/Mo/W-rich inclusions in a matrix dominated by Ni. However, over the years, I have heard that similar samples also contain a Nb-carbide phase, something I’ve never been able to find until now.
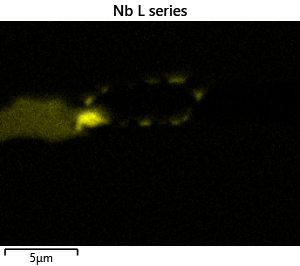
The maps below, that I collected this morning, show; on the left the typical structure I have reported so many times before, and on the right a different structure complete with a Nb-carbide phase in yellow.
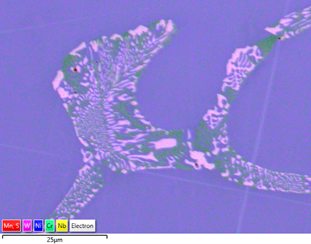
Common micro-structure of Cr carbide (Green) and Nb/Mo/W (pink) in Ni (purple matrix). TruMap to separate Nb/Mo and W/Si overlaps.
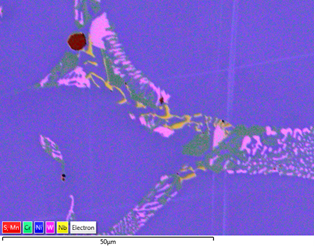
Very rare occurrence of Nb carbide inclusions (yellow).
TruMap to separate Nb/Mo and W/Si overlaps.
So, what’s changed? Well certainly not the sample. What has changed is instant real-time visualisation of morphology and chemistry using live chemical imaging. With the microscope set to 10kV and using the BSE image and the Nb X-ray map, it took me about 30 seconds of search to find the illusive Nb-carbide phase. You can see a reconstruction of my search in the video below.
Transcript: We start with the typical structure in this sample. As soon as we start changing conditions, in this case the magnification, we move to Dynamic mode. In Dynamic mode, we're following the overlay image, and the maps of particular interest, in this case, the niobium in yellow. As we start to move around the sample, we immediately see some interesting things. For example, this sulphur signal, which is in red that crossed the screen. And as we move further on, we now see this very dark patch in the bottom right, which has a very strong tungsten signal. These are two interesting and different features that I will come back and look at later. As I move on, what you now see is a very, strong, yellow niobium signal. This is what I'm looking for. So, I centre on this area, and I stop moving. when I do that, the system switches to integration mode. In integration mode, we can see much more detail about this area. With this information, we can now move on to normal AZtec to find out more details about this niobium-rich structure.
The video shows how, when moving across the samples and looking at the structures visible in morphology and chemistry together, previously missed features are easily located. As soon as I moved onto the area containing the phase, the Nb Carbide was revealed in the Yellow Nb map and the colour overlay on the electron image.
As there is nothing visually different in the electron image, there was no reason to stop on this area before live chemical imaging, except by chance. All that remained to do was centre on the area of interest, stop moving and within seconds I had confirmation that I had found what I was looking for using the X-ray maps and a point spectrum.
Once located, it’s a simple task to investigate the phase in detail, using other processing and data collection tools in AZtec.
But that’s not the end of the story; it is more like the beginning, because that quick scan of the sample revealed more phases that I had not noticed before. Areas of very dark / black contrast in the image I had probably ignored as contamination were clearly revealed by the live chemical imagery as something much more interesting.
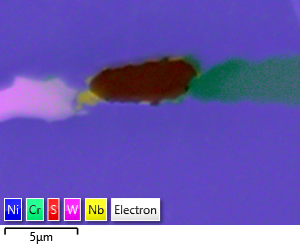
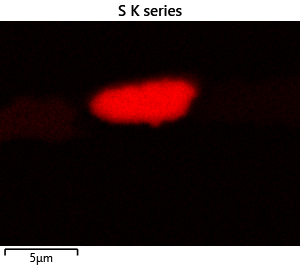
There is a population of globular sulphide inclusions in this sample; you can see them in dark brown in the maps above. On closer look they are Cr/Mn sulphides. A more detailed live chemical imaging map (below) shows small Nb carbides forming in association with them, so perhaps the two inclusion types are related.
Niobium rich carbide (yellow) forming around Cr/Mn sulphides (red). Maps and image collected using live chemical imaging.
I also found silica particles, but I wonder if they are contaminants from the sample preparation process – something to consider another day.
You can see the investigation of the other inclusions in this second video below, again with my commentary, if you would like to see more about how I use live chemical imaging.
Transcript: We're back on the niobium carbide area. And in this video, we're going to search and investigate some of the other structures that we found earlier. So, I'm changing the magnification and again immediately going back to Dynamic mode, which allows us to see what's going on as we change things. We very quickly find this dark structure with the strong tungsten signal, which is purple in the tungsten map. I zoom in to look at it in more detail, and then go to spot mode and collect a spectrum. The spectrum shows that this is not tungsten but is actually silicon dioxide. By adding a silicon map we can see a strong red signal due to the structure. In the bottom right, a message warning us that silicon and tungsten overlap in the EDS spectrum is displayed.
Silicon dioxide is more likely than a pure tungsten particle in this sample, but I will, leave further investigation of this for another day. What I'm more interested in is the sulphide inclusions. Therefore, I’m now moving to a sulphide inclusion I spotted in the earlier search. I'm zooming in and in the map you can now see a particle in red in the sulphur map. Interestingly next to it, we can see a small area with a strong yellow signal in the niobium map. So perhaps there's a niobium carbide in here as well. Moving to integration mode, we start to see much more detail, and we can see clearly the sulphur and niobium and some of the more typical chromium, and tungsten-rich inclusions. So, let's investigate in spot mode. Going to the sulphur-rich area, we can see that this is the chrome manganese sulphide, moving to the niobium-rich area, here is our niobium carbide. Finally, on to the more normal, molybdenum/ niobium/ tungsten/ silicon-rich phase.
Then we move back into integration mode to collect the more detailed map we can then save and process it anywhere else in Aztec for more investigation. Or we can investigate this area in more detail in other ways.
So, what have we learned from this story? At Oxford Instruments, we see many samples from many applications. Some samples are materials I am very familiar with; others like this one, less so. When faced with samples you don’t know much about, that contain materials you are not familiar with, you need tools that can reveal as much about them as quickly as possible. In the 30 years I have used EDS, we have moved from spectra collection to image centric Point&ID, to X-ray mapping, to TruMapping for separating overlaps, to AutoPhase mapping to distinguish phases. All these developments have helped us achieve this aim when characterising unfamiliar samples.
Live chemical imaging is the latest step change, revealing a more complete sample picture in real time and, most importantly, while you move around, so you know where to stop and look more closely. This is really helpful where the sample knowledge or sample information is missing.