There has been a dramatic change in the types of people performing EDS analysis in the electron microscope over the last 10 years. Individuals using SEM/EDS are less likely to be dedicated electron microscopists, who also looking after an SEM. It’s more likely that SEM/EDS is one of many instruments that the individual will use, so users will have less time to dedicate to each instrument. This increase in users with limited background in electron microscopy has also coincided with a greater demand for smaller microscopes equipped with analytical capabilities. The types of applications these systems are used for include Sample Screening, Failure Analysis, Quality Control and Routine Materials Characterisation.
Knowing the requirements of non-microscopists when doing microscopy helps us put together an EDS system solution that we know will allow them to do their jobs. For instance, we know that users want to get results quicker, so we developed the new high throughput Xplore EDS detector. We know that users need their results to be reliable and accurate, so we also combined a collection of powerful algorithms and software solutions to create a system dedicated to routine analysis in the SEM.
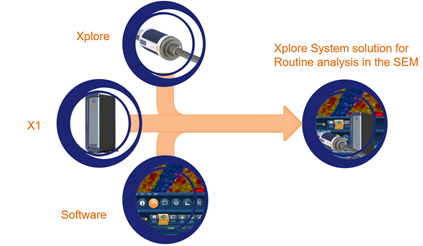
Xplore EDS System
How to make sure your results are accurate?
One of the key components to this system solution is Tru-Q, which is a unique combination of technologies that make automatic, real-time element identification and composition determination a reality. These technologies include: Robust spectrum processing that works in all situations with no need for any background fitting adjustment, complete detector and hardware characterisation for true standardless analysis, matrix correction with proven accuracy beyond that possible with ZAF or Phi-Rho-Z and automatic Pulse Pile-up Correction that works even at high count rates.
In order to ensure unparalleled accuracy and certainty of the results that our systems deliver; we have devised a standard test to verify the performance of our detectors. This test ensures that all detectors that pass will be accurate for all features that rely on the same spectrum processing such as Automatic peak identification and TruMap. In the test we measure a wide range of standard materials covering a significant portion of the periodic table to cover the widest range of materials our users may see. This includes very light elements like boron and carbon, common elements like silicon and iron and heavy elements like gold and lead.
Xplore
Ultim Max
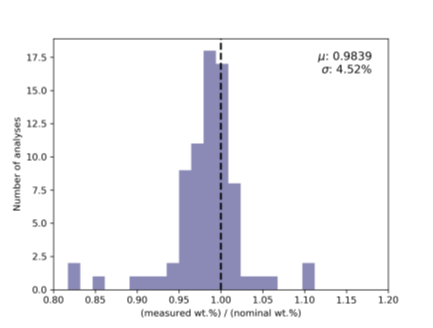
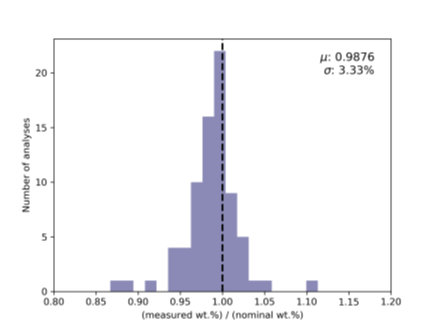
The graphs show how close the result for each element is to the certified composition for the standard. If the result matches exactly, then it will be plotted at 1 where the dotted line is on the graph. If the result is too high it will be plotted to the right of the line, if it is too low it will be plotted to the left. The aim is to have the narrowest distribution possible indicating that results for all elements are very close to the expected value.
The two graphs show a very similar distribution proving that the quality of results is similar between Xplore and systems using our high end Ultim Max detector which is universally regarded as the gold standard for quantitative EDS analysis. The distribution for both detectors shows that results can be achieved within 95% of expected value. To put this into context, this is the typical accuracy target for the quant analysis using standards to calibrate results. We can achieve this level of accuracy with standardless methods straight out of the box with no additional calibration. No other EDS systems have shown anything close to this accuracy to give you confidence in your results.
How to make sure you are measuring the right thing?
We know that we have made great strides in delivering fast, accurate and reliable results with the new hardware and algorithms, but this is pointless without the right software. So, to this end we have given users a choice of two software platforms for their EDS system:
AZtecOne is designed for those with little or no EDS knowledge, or for individuals who are just in a rush to obtain a result. It has a simplified user interface that is easy to use, intuitive and easy to train up new users.
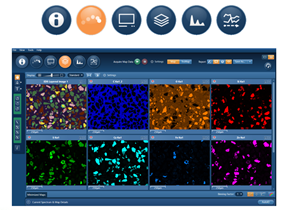
AZtecOne Software Platform
AZtecLive is designed for users who want more advanced functionality and flexibility. You can choose between different modes of operation and a host of software options.
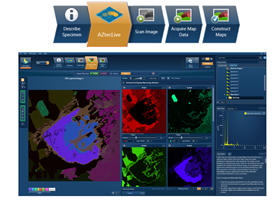
AZtecLive software platform
It can often be simple features that offer huge benefits of speed and ease of use. Here we can see that the spectrum viewer in AZtecOne and AZtecLive has the ability to compare an acquiring spectrum with a library spectrum. There is no need to wait until the acquisition is completed – Quant results are shown instantly in the MiniQuant viewer. When the user is satisfied, they can annotate the spectrum and email the results to their customer within seconds.

Live Spectrum Compare
What if the data is hard to understand?
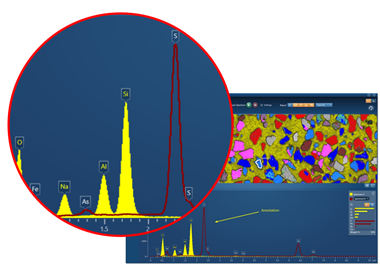
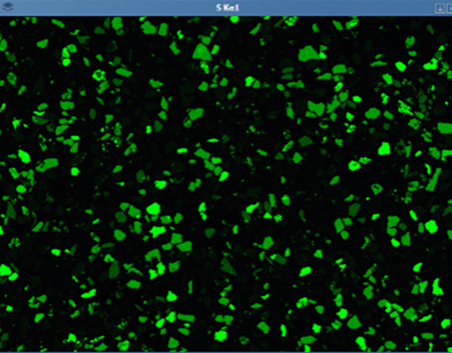
X-Ray mapping is performed when users want to determine the distribution of elements in their sample. The universal method used by all EDS systems to generate these maps is by displaying the number of X-rays detected from a particular energy range at each pixel (Windows Integral – WI). This method works well for simple materials, but here is an example of a sample where it doesn’t work well.
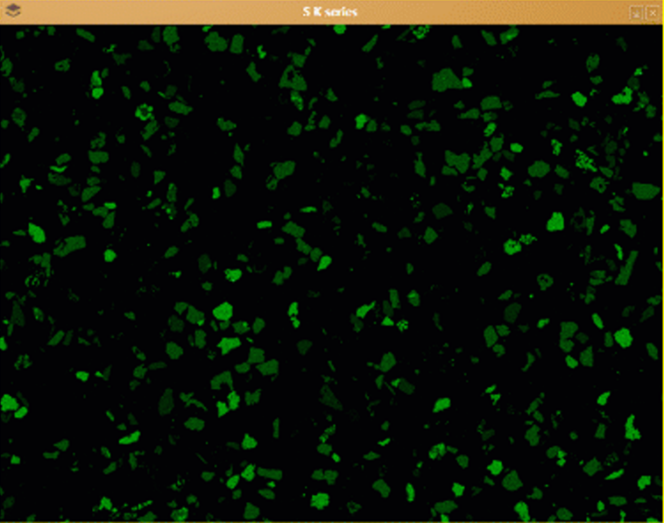
WI Map of S
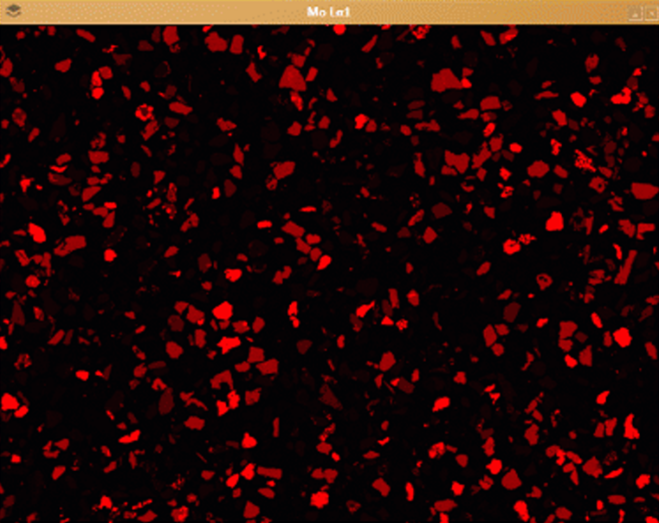
WI map of Mo
The problem with WI mapping is that when you have 2 elements that have major peaks at similar energies, then their mapping energy windows will overlap. This will inevitably mean that they will have similar looking maps. An inexperienced user could be forgiven for believing that the S and Mo distributions are very similar.
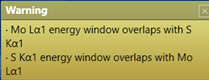
AZtec is designed to deliver accurate and reliable results to all user types. So, whenever a standard mapping acquisition is started, AZtec will inform the user of any potential element overlaps:

We developed TruMap to eliminate this problem. It uses a powerful algorithm for peak deconvolution and background removal that is fast enough to work in real time, calculating maps in seconds, either during or after acquisition (and as has previously been mentioned, features like this are only possible because of our stringent detector test procedures).
We can now see below that the distribution of S and Mo are very different when using TruMap.
TruMap of S
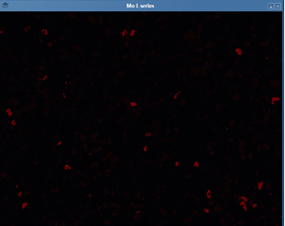
TruMap of Mo
A novice or inexperienced user cannot be expected to know this potential issue and could easily report results that are inaccurate.
Why go live?
Current sample investigation workflows are sequential, time consuming, and sometimes inconclusive. Live Chemical Imaging makes sample investigation a more dynamic, productive, and comprehensive process; allowing you to view a live electron image, live x-ray maps and live spectrum while moving around the sample so you’re less likely to miss a feature of interest.
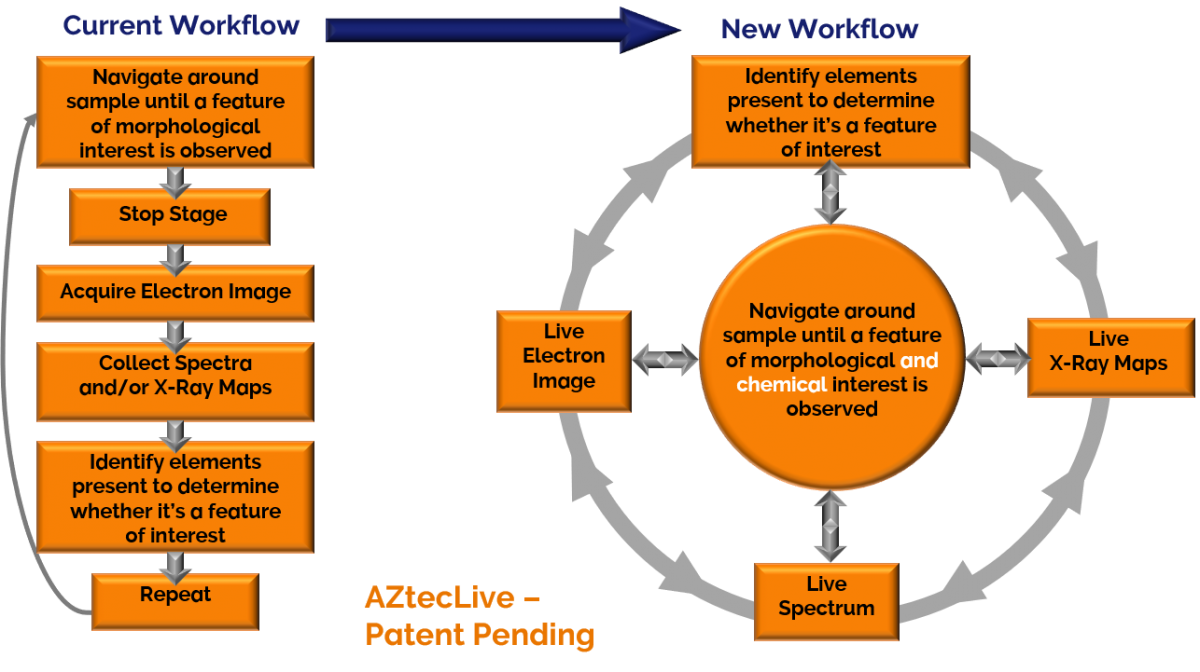
Using AZtecLive Chemical imaging enables users to find areas of interest quicker and analyse more of a sample. It also gives users increased confidence that they are less likely to miss features of interest and more likely to find an answer.
The high throughput Xplore system from Oxford Instruments is the ideal solution for carrying out routine analysis in any SEM. If you’re interested in increased ease of use, increased productivity, and increased confidence then this may be the solution for you.
Discover more