Wavelength dispersive spectrometry (WDS) is the older and rarer cousin of the widely used energy dispersive spectrometry (EDS) technique for elemental analysis in the scanning electron microscope (SEM). The are many similarities and differences between the techniques, but in essence WDS uses a mechanical spectrometer, rather than an electronic spectrometer, to measure X-ray lines one at a time instead of all at once, and has a significantly higher spectral resolution than EDS.
It is this enhanced spectral resolution that is the critical technical advantage of WDS, and means it can be used to solve challenging elemental measurements that are more difficult or impossible to do by EDS. The resolution is typically in the region of 10x better on the highest performing spectrometers, meaning that almost all peaks present in the X-ray spectrum can be separated and the peak to background ratio is significantly higher. WDS is used when complex overlaps are observed in the EDS spectrum, particularly when one of the constituent elements is present at low concentration, or when trace elements need to be detected using X-ray signals that are not differentiated from the background in EDS.
Take, for example, the common but very close overlap found in materials containing two transition elements: titanium and vanadium. This is the overlap between TiKb (4.932keV) and VKa (4.952keV), particularly familiar to analysts investigating Ti-V-Al alloys and Ti-V minerals. The separation of these lines is only 20eV, or in reality a little less due to the presence of the VKa2 line (4.945keV). A good EDS spectrometer will have an energy resolution of around 120eV at this energy, therefore, the two lines cannot be independently resolved. This can be seen in the EDS spectrum collected from a Ti-6Al-V alloy below, where the vanadium signal appears as an increase in the height of the TiKb line and is only apparent when using the EDS software to show the separate Ti and V contributions.
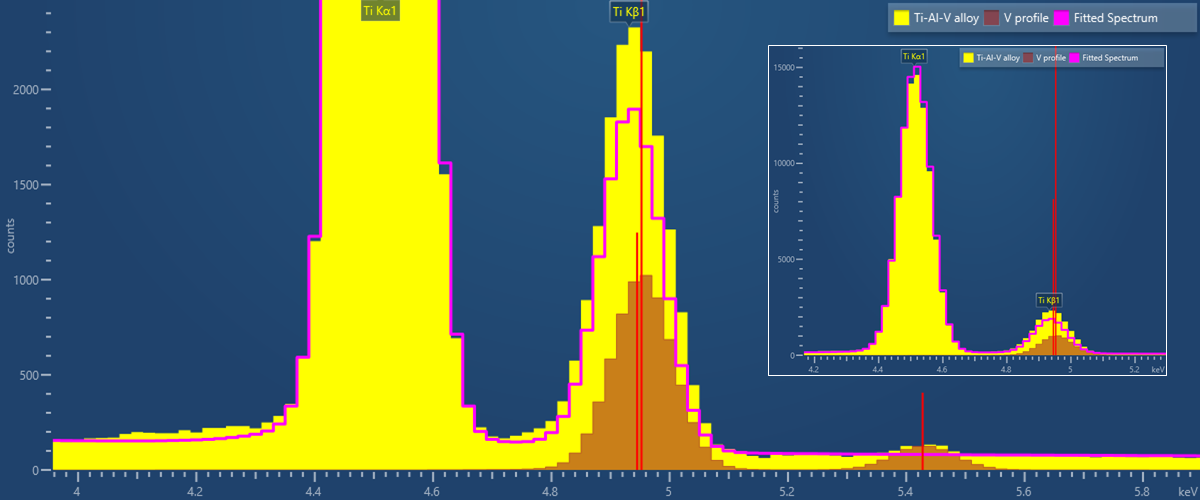
EDS Spectrum collected from Ti-6Al-4V. The pink overlay shows the contribution of Ti to the spectrum, the remainder is due to V, whose K-profile shape is shown in brown. The inset shows the same spectrum rescaled to show how the relative heights of the two peaks are not consistent with only the presence of titanium.
This overlap is sufficiently close that even many WDS spectrometers, particularly those using flat diffracting crystals, can’t provide much additional information. We have collected data on this sample using the Wave spectrometer. We collected three WDS wavelength scans and for comparison we show the EDS spectrum in green. In its standard analytical configuration the separation of the TiKβ from VKα is shown by the yellow spectrum. The presence of both lines is now clearly visible, and the separation is good enough for accurate quantitative analysis, with a spectral resolution of only 8eV. The magenta spectrum was collected using a special mode where an entrance slit in the spectrometer is closed down. This can be used to provide ultra-high spectral resolution scanning, and in this case reveals the presence and position of the VKa1 and Ka2 lines, collected with a spectral resolution of less than 6eV. Contrast these results with the red scan which has a resolution of about 20eV more typical of many flat crystal WDS spectrometers where the presence of the VKa is not definitive and quantitative analysis is therefore not possible. This red scan was also collected by the Wave spectrometer, but in its higher count rate mapping mode, used when spectral resolution is not so vital. This high count rate mapping mode is conducted with the entrance slit fully open.
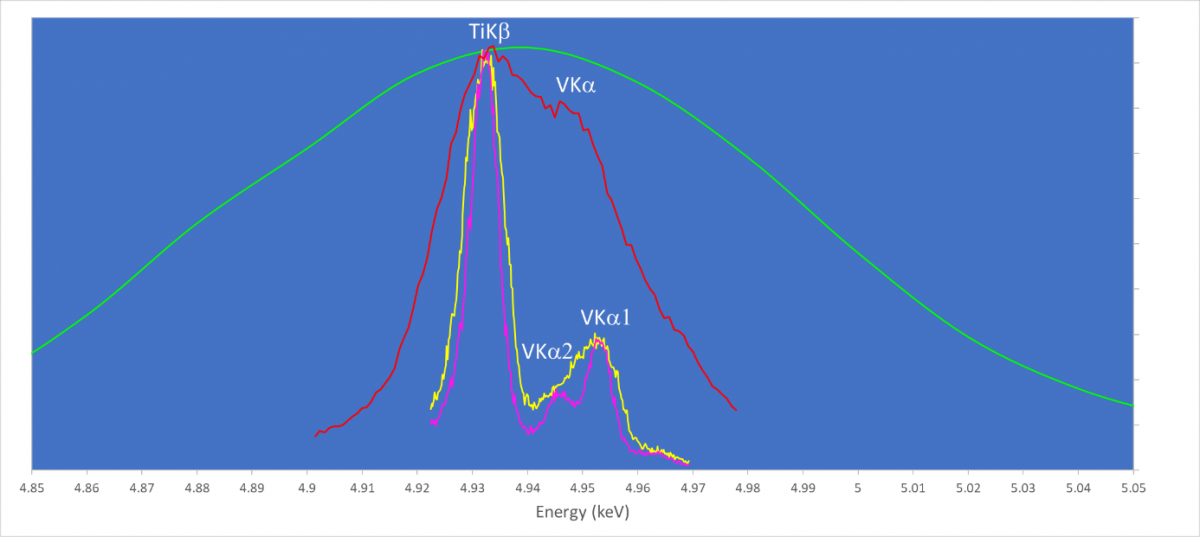
Wavelength scans collected using the Wave spectrometer at ~20 (red), 8 (yellow) and <6 eV (magenta) spectral resolution. For comparison, an EDS spectrum from the same phase (green) is shown.
People often ask me why Oxford Instruments offer the Wave spectrometer, which is so much larger and takes up more space on the SEM. One of the main reasons is the high spectral resolution, which means the spectrometer can be used to separate X-ray peaks with smaller energy gaps and work on more difficult analytical challenges. After all, that is what WDS is for.
The other advantage of improved spectral resolution is lower background. Lower background means better and faster detection of minor and trace elements. When analysing trace elements at the 100 ppm level, this can result in collection times over 4 times faster (or alternatively a much lower beam current can be used) than can be achieved with a flat crystal spectrometer with its limited spectral resolution. This is another very significant performance difference that can be crucial to the viability of this type of analysis.
Learn more about the advantages of WDS