Sometime in November 1993 I became a regular user of an electron microprobe. Therefore, I will be celebrating 27 years of WDS analysis come November. While we learn something new every time we put a sample into the microprobe, or for me these days the SEM, this past 6 months has demonstrated to me again that expertise does not necessarily mean having all the right answers.
A big part of our new AZtecWave software, which we have been developing this year, is new technology to help the user set up the collection parameters for their analysis. Even self-proclaimed experts like myself sometimes struggle with all the things we need to think about:
- How long should I acquire for?
- How long should the background acquisition time be?
- What beam current should I use?
- What background positions should I choose?
- Is another element interfering?
- How can I reduce the error in the analysis?
The usual answer to this, is we use ‘rules of thumb’ that we have built up over the years, as we learn from theory and practice. Until we build up that experience and expertise we rely on the system or our seniors/peers for guidance. For system guidance in AZtecWave we have built up a workflow that uses the available information to answer these questions for every analysis. It takes in available information directly from the sample and microscope:
- Sample composition from an EDS spectrum
- EDS detector count rate and deadtime
- Accelerating voltage
- Beam current (calculated from the absorbed current measured directly from the sample)
All that is required from the user is the elements to be analysed by WDS.
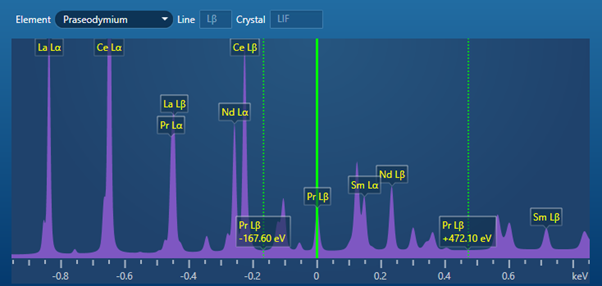
Using this information, the AZtecWave software synthesises a WDS spectrum and calculates the collection set-up prior to any WDS data being collected. An example synthesis for a complex phosphate mineral with light rare earth/lanthanide elements is shown below. In this case it shows the line chosen by the software for the Pr (Praseodymium) element acquisition and the positions chosen for background acquisition, all of which avoid interference of the many other peaks in this part of the spectrum.

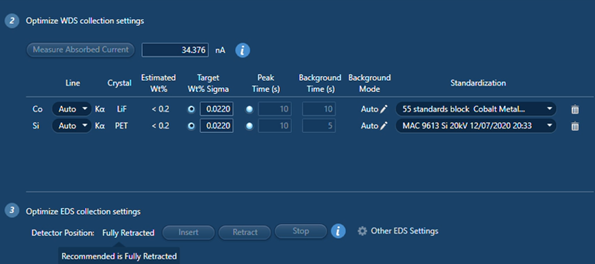
The software also calculates the other optimum set-up parameters (e.g., peak and background counting times) and tells you how long the analysis will take. This is great because that also gives you the opportunity to change things. If the time is longer than you want, you can increase the beam current or accept a lower precision for the result. Both will reduce the time required, and you can directly see the effects before you collect anything more than an EDS spectrum.


Which brings me back to where I started with this blog. Suddenly I have a new experience where instead of using all my expertise to set up a WDS analysis, I am using it to ask myself, ‘would I have set it up that way?’ The answer is clear already, although I clearly knew what I was doing, and was making sensible adjustments for the type of sample, the element, the element concentration and the microscope. I still have a bit to learn about what beam current and count times are actually required to produce the data quality desired. From discussions with my colleagues and customers, who have seen this new approach – they seem to be thinking the same.
Since using this new technology we are using lower beam currents, and shorter counting times, making for a more efficient analysis. The peak times calculated by the technology are normally shorter, but background times no longer follow the rule of counting for half the peak time on each background. For optimum major element analysis we have found that these ‘rule of thumb’ background counting times are too long, and for trace element analysis they can be way too short.
So far I have to admit 27 years of experience and expertise is not a match for our spectrum simulation and automatic set-up, and it does make for a much more efficient WDS acquisition, and one where I am confident of success first time. This feels like the biggest change in WDS analysis I have seen in a long time. Watch our recent webinar to see our new software in action.


