Part of the Oxford Instruments Group
Expand

AZtecLive SmartMapping and Line Scanning

Understanding how elements are distributed across your sample is key to any sample investigation. AZtecLive has a selection of powerful tools specifically designed to help characterise your sample. At the heart of these tools is AZtec SmartMap spectral mapping, which records all X-ray data at each and every pixel and creates a virtual sample that can be reanalysed at anytime in the future.


Request Pricing Add to quote list

EDS Element mapping – AutoLayer, TruMap & Spectrum Examiner

Combining and overlaying EDS Element maps on an electron image to make one informative coloured image is fast becoming a common way to view the distribution of elements in a specimen. But it’s important to know that the data behind this good-looking image is correct...

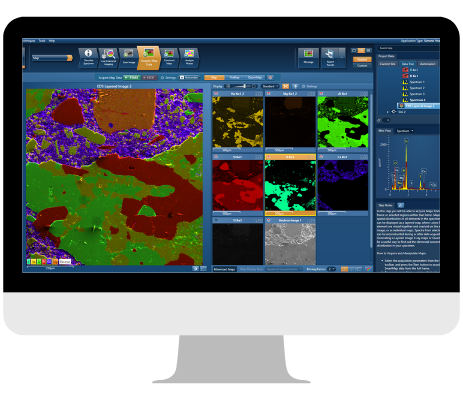
Layered image gives complete picture of composition and phase distribution.

SmartMap 

SmartMap spectral mapping brings the benefits of automatic qualitative analysis into two dimensions to identify elements and show their distributions. Now see how all elements are distributed in a specimen

  • No specimen pre-knowledge required
  • Maps for all elements identified and generated automatically
  • Single Layered Image highlights chemistry and phase distribution in seconds
  • Up to 4K SmartMap resolution to combine wide area and high-resolution studies

AutoLayer - a complex story made simple

At the click of a button, AutoLayer takes the often complex information contained in a set of X-ray maps and turns it into a single image that helps you visualise both phase and element distribution in your specimen.

  • Instantly and automatically interprets your specimen
  • Highlights what’s important in a single image
  • Unravels the complexity of real specimens
  • Colours on the Layered Image correlate to the X-ray map colours

TruMap

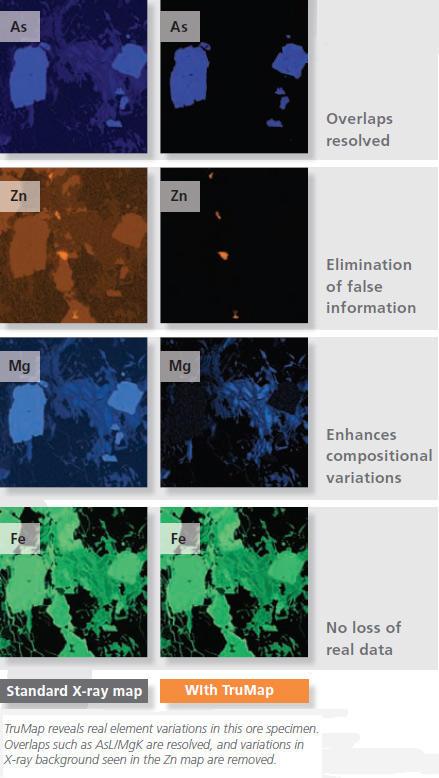
TruMap is a unique real-time mapping solution that takes advantage of the increased counts generated by the latest SDD detectors, offering a new level of data integrity......now you can see the real element variation.

  • Eliminates artefacts
  • Corrects element overlaps
  • Removes false variations due to X-ray background
  • Everything operates in real-time

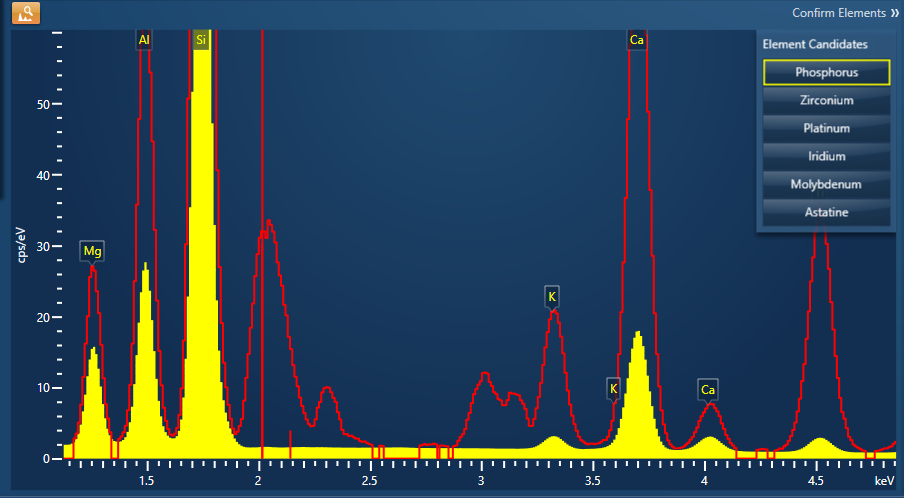
Map sum spectrum

Spectrum Examiner

Spectrum Examiner enables small phases to be detected that would otherwise be overlooked

  • Automatically analyses a SmartMap
  • Highlights interesting energy regions in the sum spectrum where there is a significant variation in pixel counts.

Phase analysis - AutoPhaseMap

Specimen characterisation can often be time-consuming and requires a highly skilled operator to interrogate the data. At a touch of a button, AutoPhaseMap automatically finds areas of different characteristic composition from X-ray map data and determines the distribution, area, constituent elements and generates an easy to interpret Phase Image.

AutoPhaseMap is a new way of automatically creating a phase distribution map of a specimen.

During or after an acquisition, AutoPhaseMap automatically:

  • Turns X-ray map data into Phase Map data in seconds
  • Calculates and displays:
    • distribution of each phase
    • spectrum and composition for each phase
    • area fraction for each phase
  • Finds phases for all size ranges, including nanomaterials
  • Finds hidden phases, highlighting missing elements which are present in trace amounts

Making Large Area automated data collection an everyday occurrence

  • An easy to use wizard guides users through the setup process and ensures that even the most infrequent user can acquire a Large Area Map
  • Accommodates tilted specimens to ensure that images are always in focus
  • Images are automatically aligned during acquisition to ensure a seamless LAM dataset both before and after montaging
  • Acquire up to 1500 fields, each with a maximum resolution of 8K x 8K, and X-ray maps with a maximum resolution of 4K x 4K, to create an image dataset of up to 96 billion pixels and an X-ray dataset of up to 24 billion pixels
  • LAM is fully interactive during acquisition: enabling users to view all the data combined, and also zoom into the fine detail
  • An individual field can be interrogated and X-ray map properties modified. Changes can then be applied to all fields in the LAM ...even during acquisition!
  • Automatic system pause when a blown filament is detected - once the filament is replaced, acquisition can be resumed

LAM montages all the acquired data into a single SmartMap dataset with up to 64 million data points.

Exploiting the power of 64-bit processing, users can interrogate the montaged data in the same way as a standard SmartMap dataset, and:

  • Add/remove maps
  • Reconstruct deadtime corrected spectra from the SmartMap data and obtain accurate quant results
  • Create TruMaps and AutoPhaseMaps

Visualise element distribution along a line

LineScan
LineScan brings the concepts of AZtec real-time acquisition and reporting to the study of linear variations

  • Visualise LineScans clearly, quickly and easily
  • Flexible views make interpretation easy
  • View LineScans in stacked or tilted format
  • Normalise display to compare major and trace element variations easily

TruLine
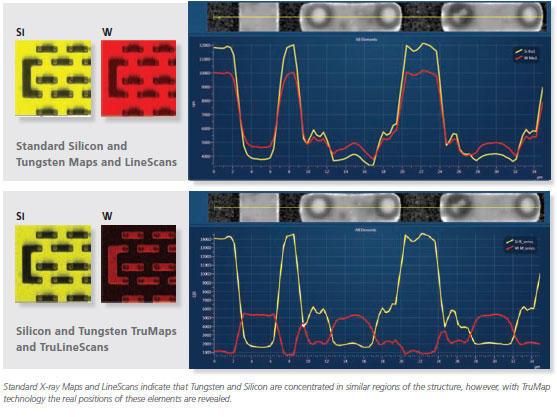
Incorporates TruMap technology ensuring that you will see real element distribution

  • Corrects for peak overlaps automatically
  • Enhances real elemental differences by removing X-ray background variation
  • Aligns image and LineScan for clear visual comparison
  • Normalised intensity scales make a comparison of major and minor elements simple

QuantLine
Utilise the accuracy and repeatability of Tru-Q to see quantitative element variations

  • No need to wait for lengthy data processing....see quantitative linescans live!
  • Quantitative results are shown in Wt% or At%
  • Table of results can be exported to Excel

General

  • Point spectra can be extracted from any of the linescans for further, more detailed, analysis
  • Data can be viewed in graphic form or as a table
  • Linescans can be binned to improve statistics
Standard X-ray maps and LineScans indicate that tungsten and silicon are concentrated in similar regions of the structure
Brochure: AZtecLive & Ultim Max

AZtecLive takes the EDS technique from the static to the dynamic with real-time chemical imaging. AZtecLive is powered by Ultim Max, the next generation SDD detectors combining the largest sensor sizes with Extreme electronics to deliver unparalleled speed and sensitivity.

Download
App note: AZtecLive In Depth: Tru-Q

This application note describes the unique approach and technology used in AZtecLive EDS systems to provide automatic real-time element identification and composition determination.

Download
App Note: AZtecLive In Depth: TruMap

This application note shows how TruMap displays in real-time the real variations of elements in a sample. It describes how minor element variations in a refractory oxide containing slag sample created during clean steel manufacture can be studied.

Download
Blog: Find small and discreet phases

This blog post shows how Spectrum Examiner can help you find small and discrete phases so that elements can be easily identified. It also demonstrates in detail how to use this feature with Aztec’s SmartMaps.

Read more

Get in touch