Introduction: Why is asbestos analysis crucial?
Asbestos is a material that was widely used in the mid-late 20th century as an insulator (in buildings, boilers, pipes, roofing and floor tiles even car insulation, brake pads & clutches) with fireproof properties. These desirable properties exist due to the strongly fibrous nature of asbestos. Unfortunately, this fibrous nature also makes asbestos dangerous if inhaled, as the fibres may lodge in the lungs and cause conditions such as asbestosis, mesothelioma, and lung cancer. As such, asbestos needs to be removed when it is found, especially during renovation works, so that this danger is removed.
 The Problem
The removal of asbestos is routinely performed by specialist companies who are able to complete the job efficiently and safely. However, this work can still be both expensive and time consuming with significant potential to delay projects. As a result, there is a clear and strong desire to understand whether asbestos is indeed present at a given site.
One of the frequently used approaches for testing for the presence of asbestos at a site is to filter large volumes of air to check if free fibres are present (also their length and number). These samples (air filters) are routinely captured on polycarbonate filters, which may be (pre)coated with gold (Au), as shown below (Figure 1).
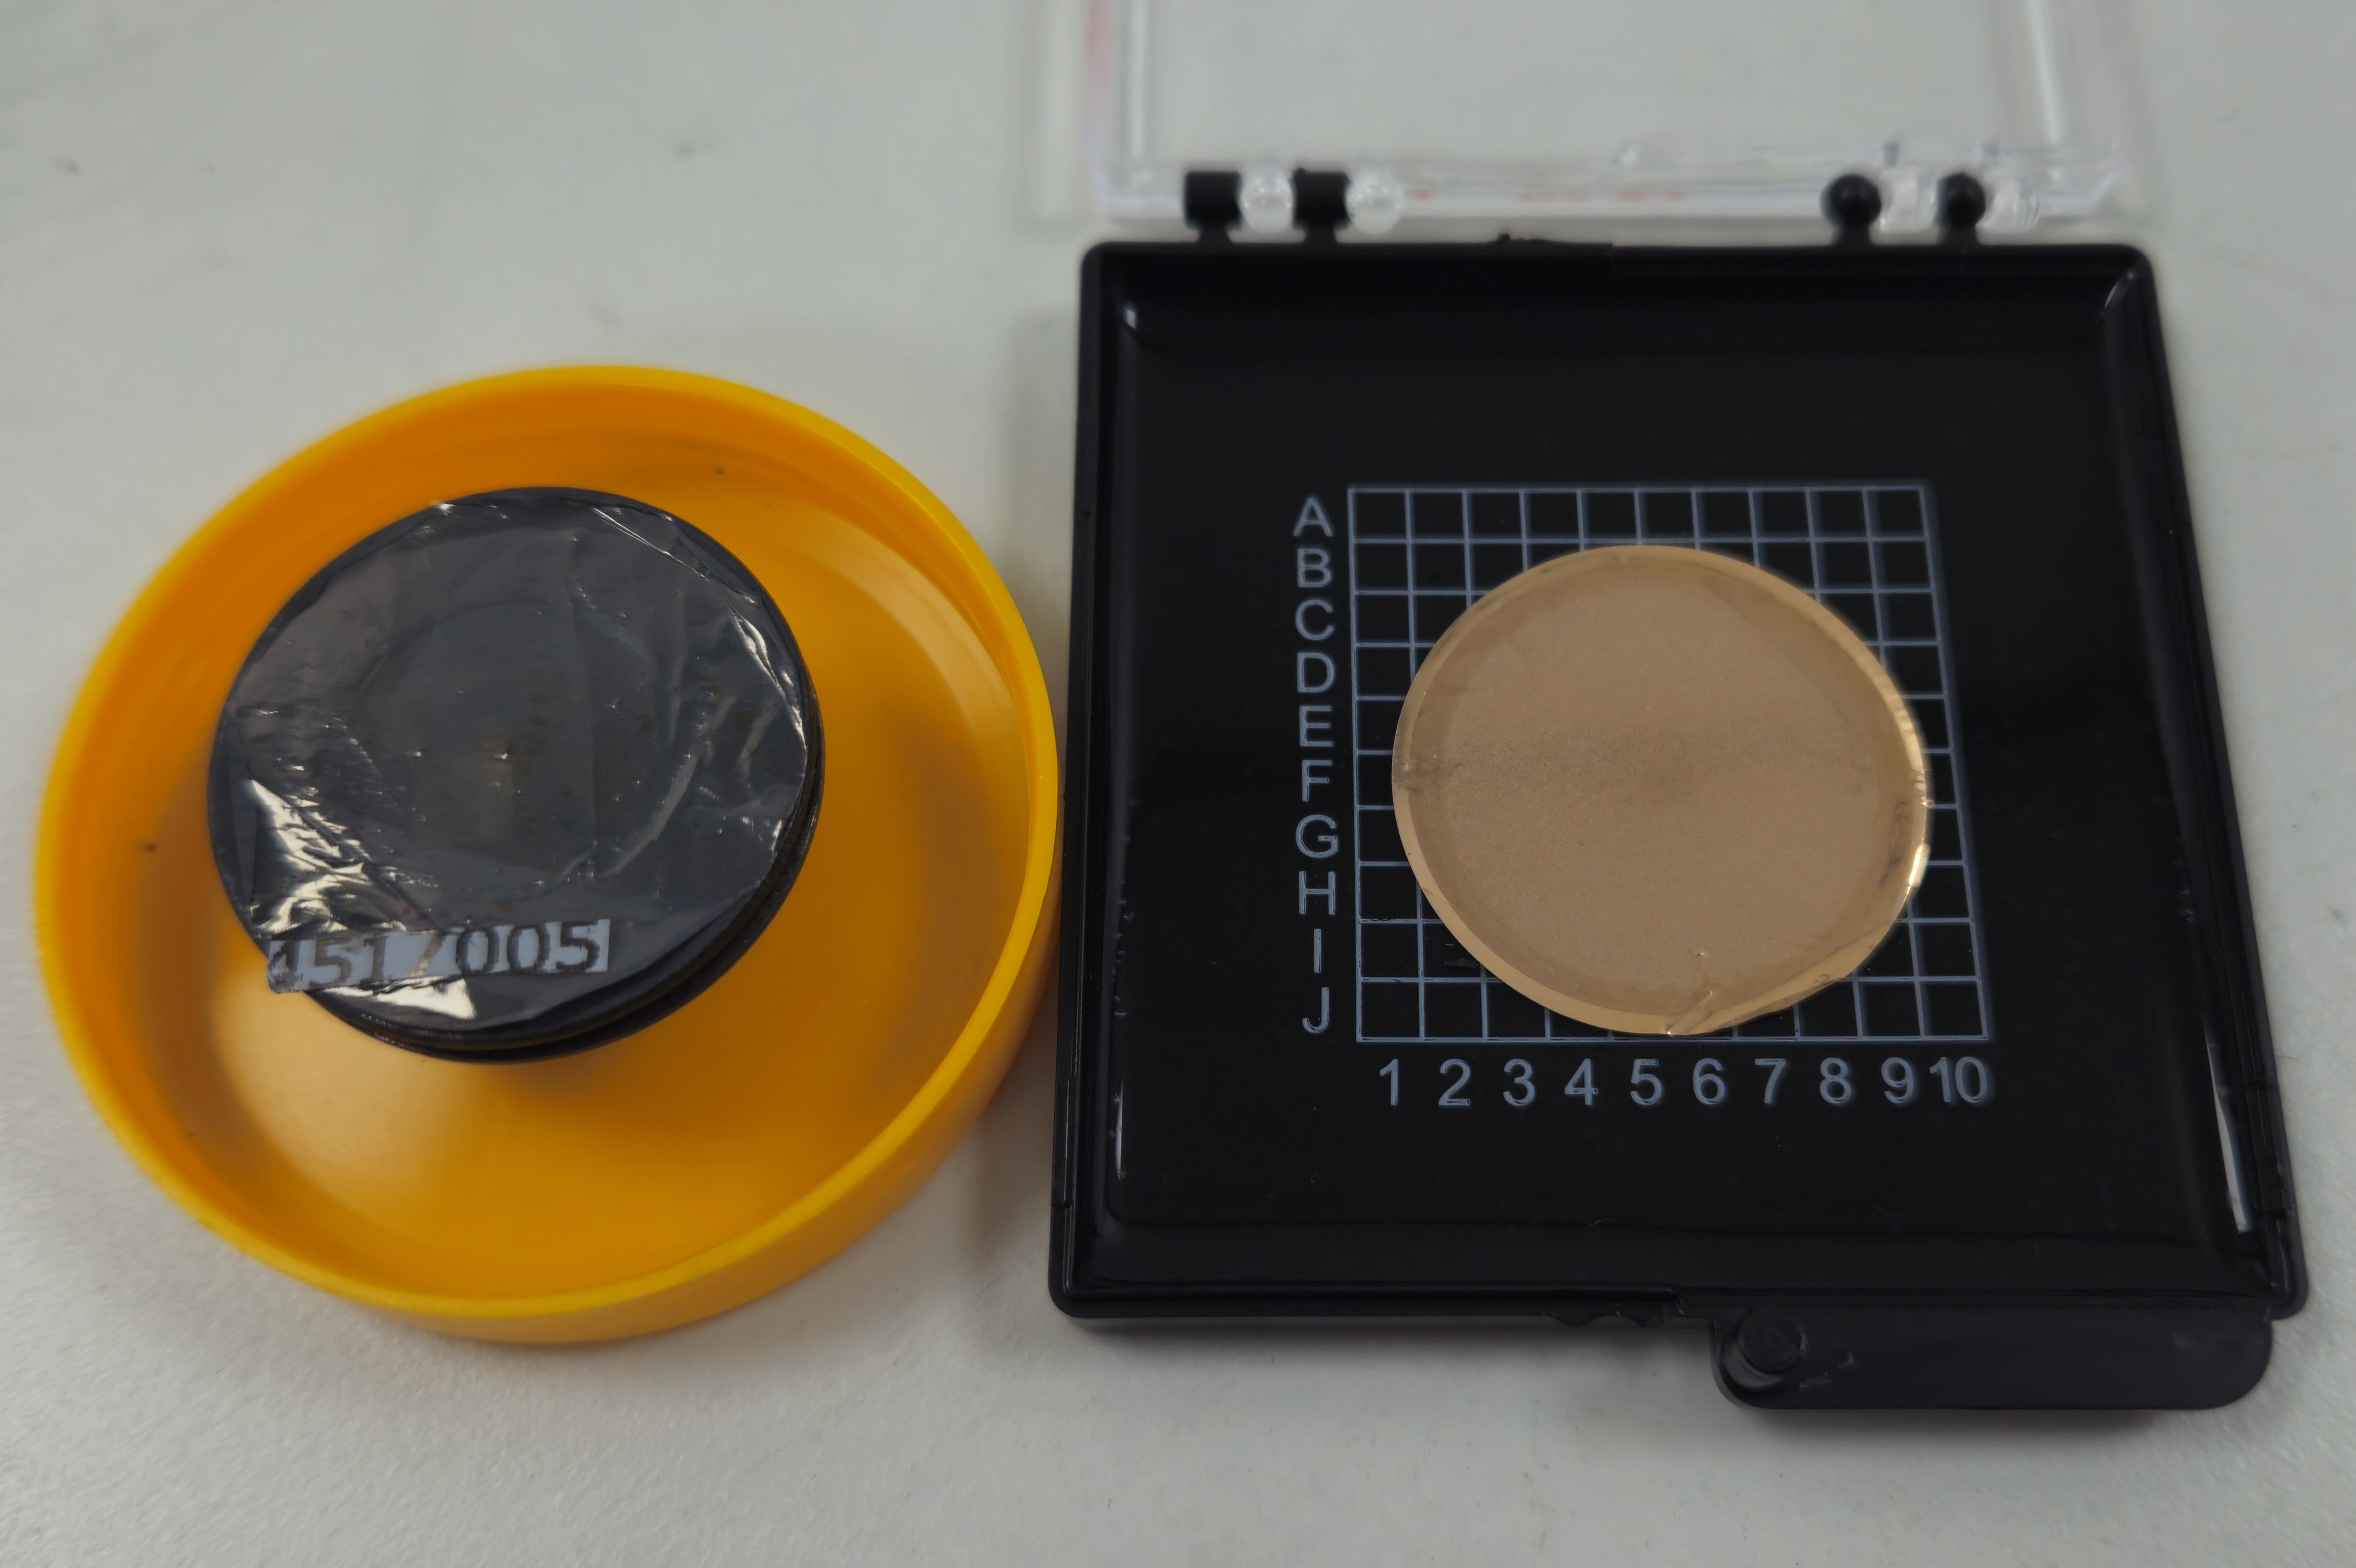
Once collected, these filters need to be analysed to determine if asbestos fibres are present on them. Confirmation that a detected fibre is indeed asbestos requires the analyst to have assessed that both the morphology and composition of a given fibre are as expected for asbestos.
The Solution
Given the above requirements, an approach that incorporates both imaging and compositional analysis is required. Here, we discuss how this analysis can be performed in a scanning electron microscope (SEM) equipped with an energy dispersive x-ray spectrometry (EDS) detector.
In order for an analytical solution to this problem to be effective and to bring benefits to the user, it should be automated (thereby freeing up user time to focus on other tasks and allowing analysis to take place unattended outside of traditional working hours) and fast, whilst maintaining reliability and accuracy. An additional benefit to an automated approach is the fact that user bias is also removed, thereby potentially further enhancing the quality of results.
AZtecAsbestos is a dedicated implementation of the market-leading AZtecFeature automated particle analysis platform which utilises a novel, pretrained, deep learning model (developed and trained in-house using a dataset comprised of 25,000 training images) to selectively detect fibres from automatically obtained electron images. In addition to automated imaging and fibre detection, it also automates the acquisition and processing of EDS data to provide clarity on particle composition before adding in a layer of interpretation via a classification process.
Fibre Detection
AZtecAsbestos’ machine learning trained algorithm has been developed to ignore debris and non-fibrous particles (Figure 2). This approach enhances efficiency and throughput, in comparison with a traditional grey-level thresholding based approach, by ensuring that features that do not have a fibre morphology do not have time spent on them for EDS analysis. This approach also minimises instrument setup time, increases ease of use (again, in comparison to the grey-level-thresholding-based approach), removes the opportunity for setup errors and reduces the chance of operator bias by automatically handling the fibre detection process.
Importantly, both secondary electron (SE) and backscattered electron (BSE) images are able to be used with this algorithm – as, depending on the specifics of the analytical system and sample in question, one might be better than the other at any given time (e.g. if small, thin fibres are obscured by the strong background of BSE images).
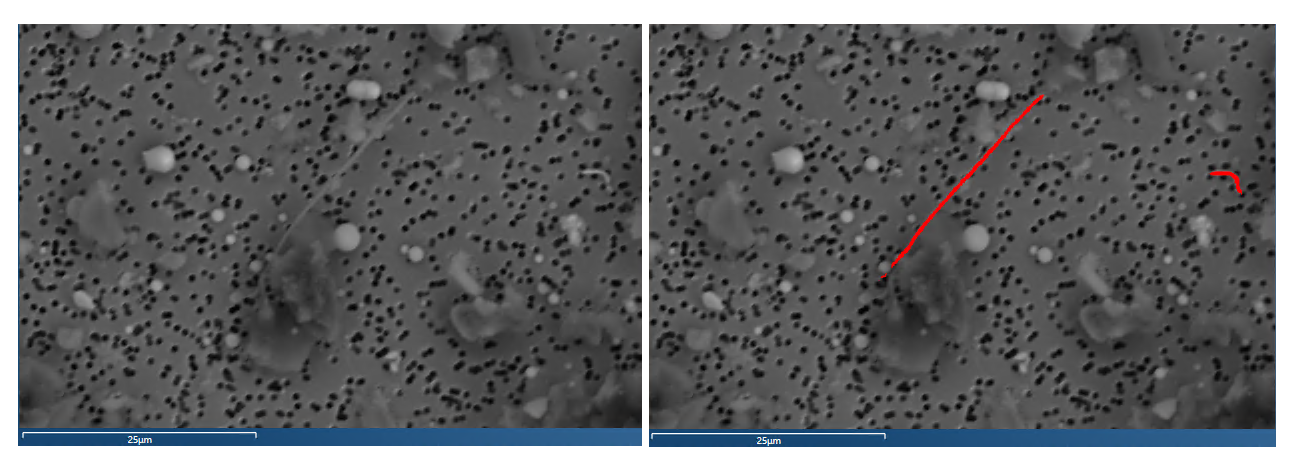
An additional problem which sometimes occurs in the analysis of asbestos is the overlapping of fibres. An example of this can be seen in Figure 3. The left-hand image is the raw electron image that was collected of the field. It is evident to the human eye that 3 individual fibres are present and overlapping with each other. The right-hand image shows the detection performed in this study, utilising AZtecAsbestos. The individual colours applied to the 3 fibres in this image show that the fibres have been individually (and correctly) detected ahead of their subsequent EDS analysis.
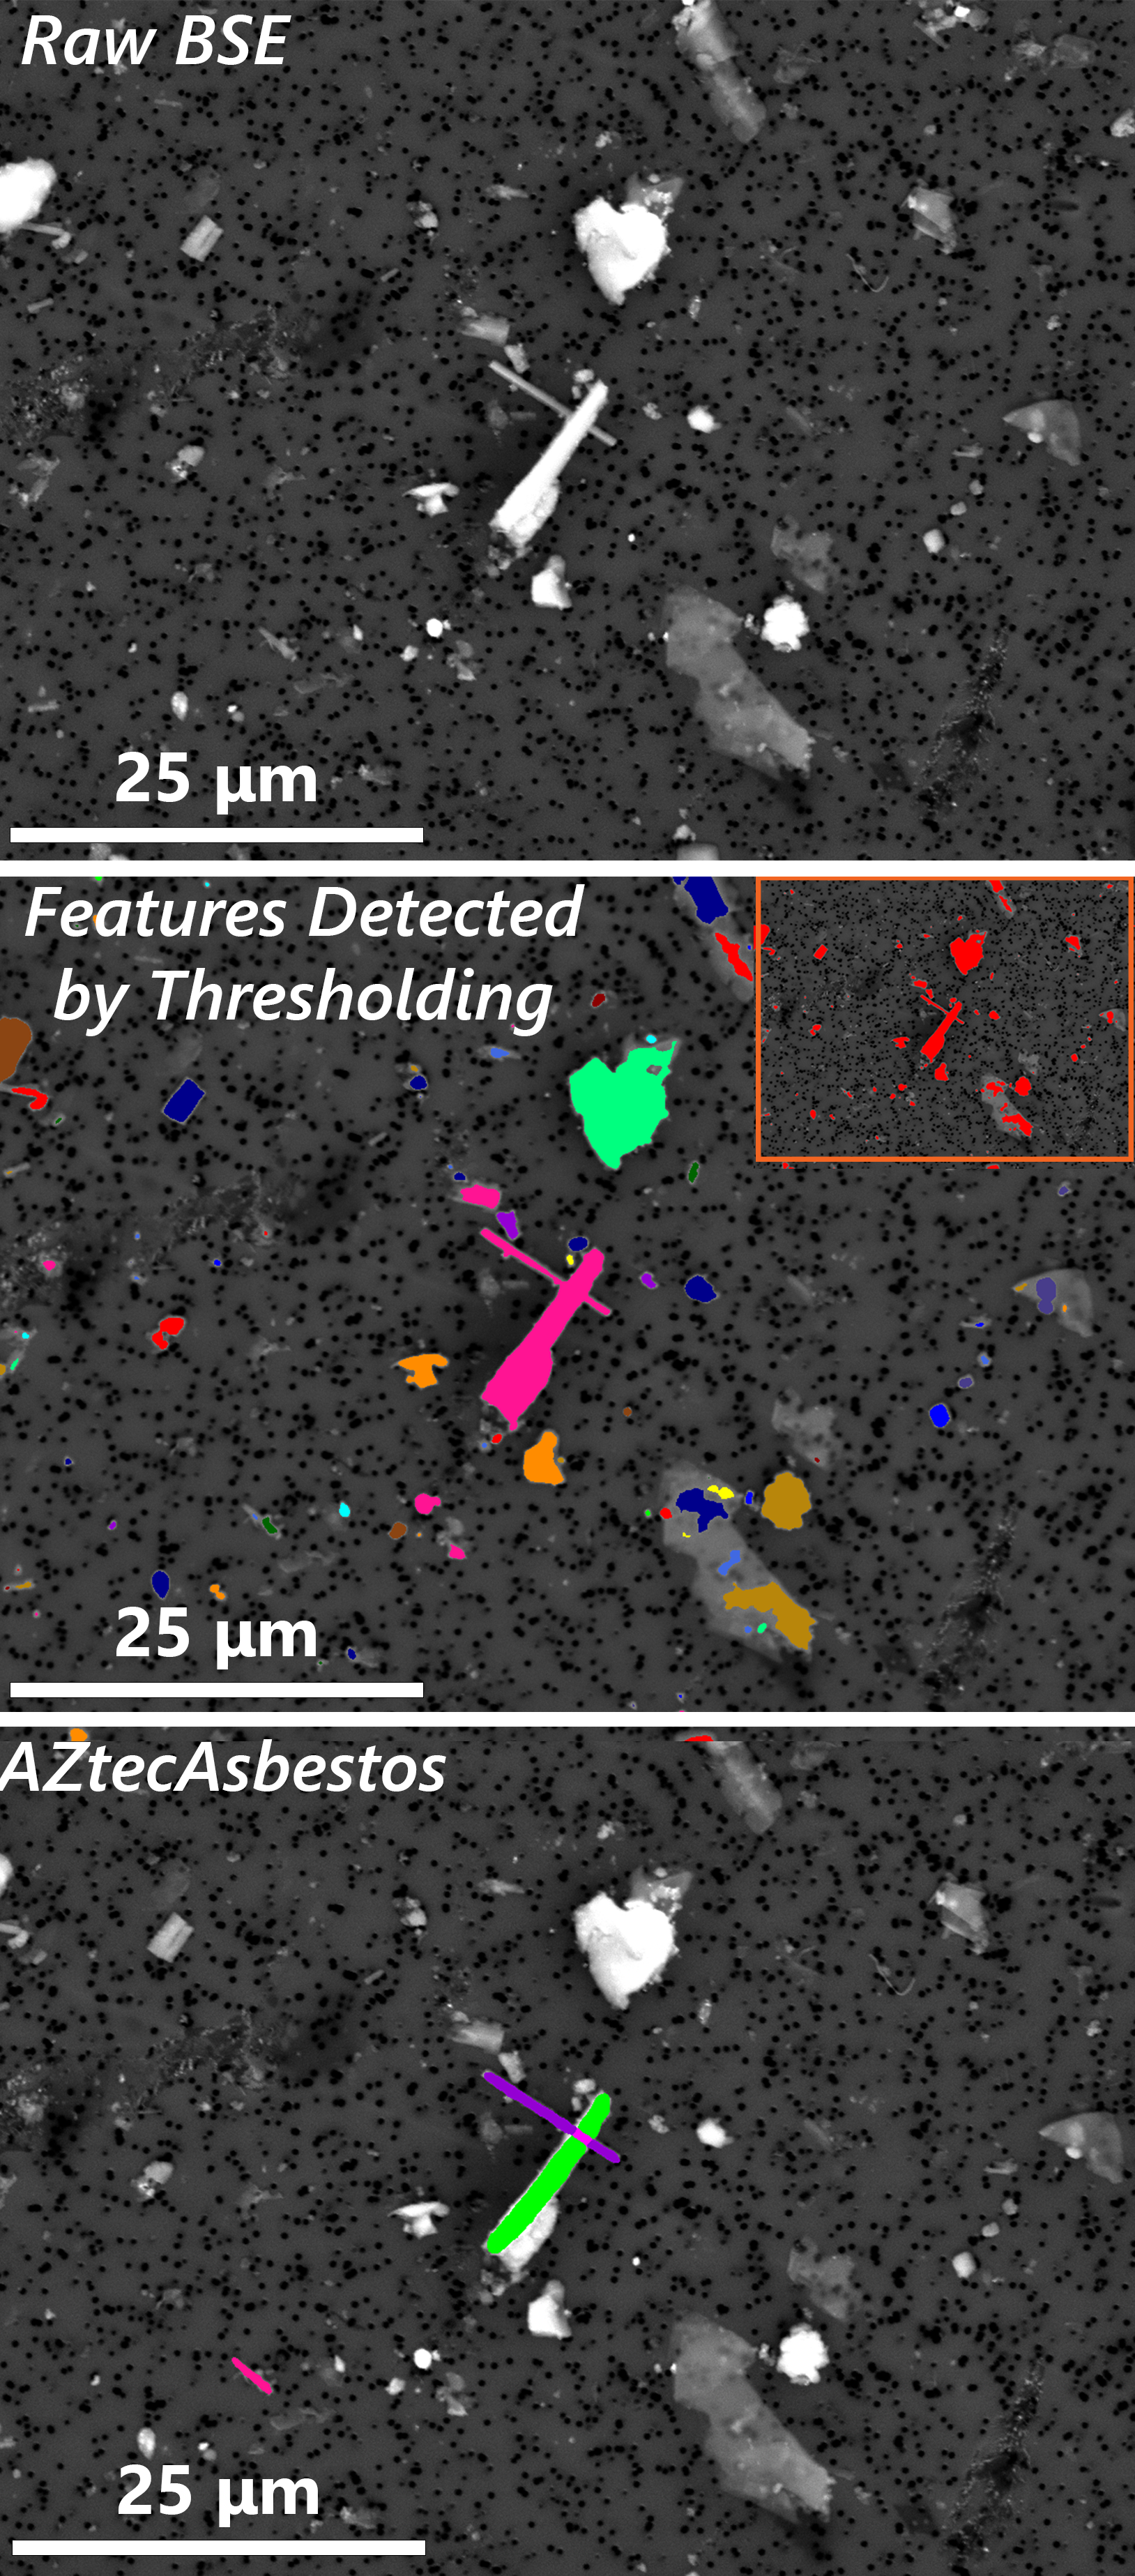
Given AZtecAsbestos’ ability to detect fibres, one might ask how standard thresholding compares to the AZtecAsbestos model for fibre detection. Figure 4 makes this comparison. As mentioned above, AZtecAsbestos is trained to detect fibres while ignoring debris in the sample. The top image in Figure 4 shows a BSE image of a sample containing fibrous material – this is the image on which fibres must be detected. Standard thresholding (Figure 4, middle) picks up a lot of debris falling into the threshold, and in addition sees the overlapping fibres as a single feature that will be analysed as one entity. As a result, if the standard grey-level-thresholding approach were used as the basis for EDS analysis, a large number of analyses would be performed on debris particles, and the fibres of interest would not be analysed individually. This would lead to poor throughput and an incorrect assessment of the number of fibres present – with errors in the identification of the asbestos species also possible as only a single spectrum would be acquired from the overlapped group of 3 fibres – leading to mixed spectra if they are of a different composition. In contrast, when AZtecAsbestos is used (Figure 4, bottom), debris is automatically rejected and overlapped fibres are identified individually meaning that both throughput and accuracy are achieved.
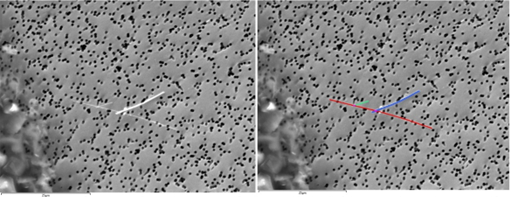
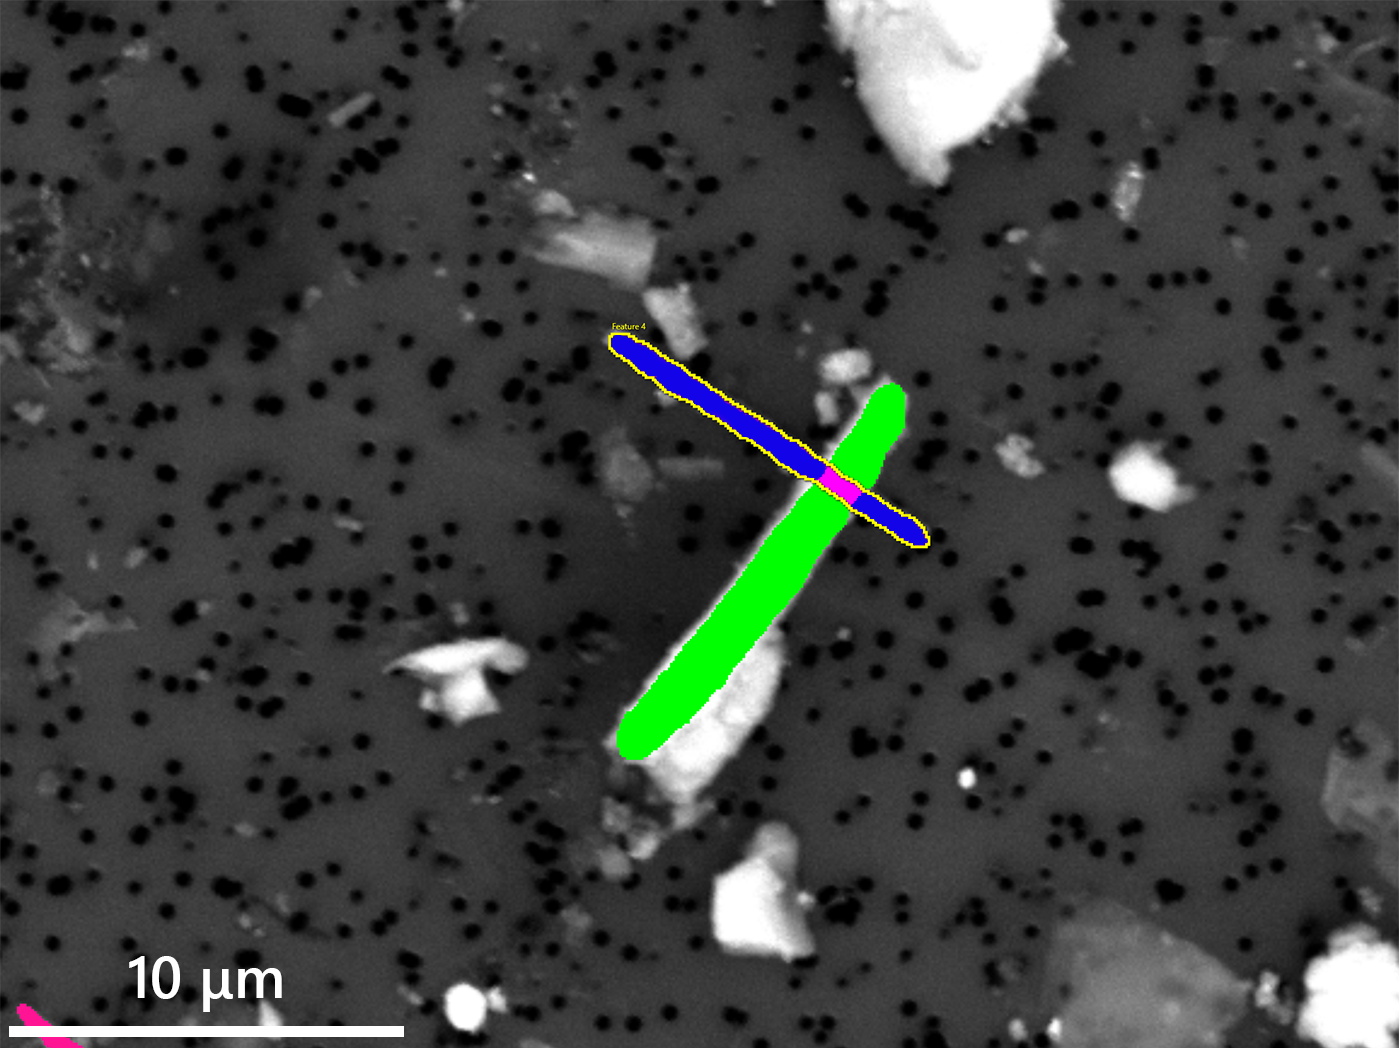 Given the above mechanism for detecting overlapping fibres, AZtecAsbestos goes a step further and prevents the collection of EDS spectra from overlap regions, thereby preventing the collection of mixed spectra (which would harm subsequent attempts to identify species of asbestos). The overlapped regions are marked (Figure 5) so that it is clear where EDS spectra are and are not collected from.
Morphology Measurements
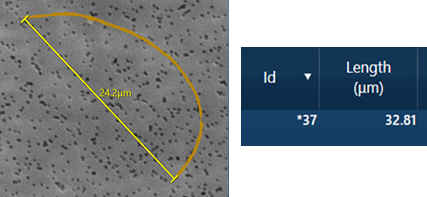
Once fibres have been detected, it is essential that their morphology is measured in a way that is appropriate for the application. Fibre lengths are measured directly, instead of via a bounding box (as is often done) to ensure that particle lengths are true regardless of how fibres may be curved or twisted (as is often the case with chrysotile) (Figure 6).
EDS Analysis
With the fibre detection algorithm having minimised the number of required EDS analyses per field by removing debris, the next factor for influencing throughput becomes the rate at which EDS measurements can be performed. This is maximised through the combination of the system’s batch handling of the fibres to be analysed and the use of either Ultim Max Infinity or Xplore EDS detectors with larger sensor areas enabling shorter live times per fibre.
Every single collected EDS spectrum is fully processed with AZtecLive’s TruQ-IQ collection of spectrum processing algorithms. These algorithms correct for various physical phenomena including matrix effects and pulse pile up. In addition, they ensure accurate element identification and ultimately quantification. The advantage to using such a “ground-up” approach rather than other commonly used approaches such as spectrum matching is that one can be as confident in the analysis as if one were performing a manual investigation of a sample including high quality quantification. Furthermore, the approach also allows analytical conditions (such as accelerating voltage, beam current etc) to be changed as required – as these parameters are taken into account as part of the algorithms’ processing.
Classification
Once EDS spectra have been collected from the fibres, the next stage of the analysis process is to classify the analysed fibres. This process is performed automatically as each fibre is analysed using an inbuilt classification scheme. The scheme contains all asbestos types but can be further edited or added to by the user in order to meet any further requirements at any time.
Large Area (Multi-Field) Sample Analysis & Sample Reconciliation
The analytical process described above is then applied to every field of a large area run setup across the sample. AZtecAsbestos allows for large area acquisition and automation, so that you can also minimise instrument down time and collect data from multiple samples in one run.
Once fibre detection and EDS analysis are complete, there is the option to reconstruct fibres if they are split across more than one field of view. This brings the benefit of correcting the number of counted fibres in addition to morphology measurements being corrected.
Results
We used AZtecAsbestos to analyse an air filter sample and found:
A total of 942 asbestos fibres, of which:
- 771 identified as anthophyllite and
- 93 as chrysotile
- 77 as actinolite/tremolite
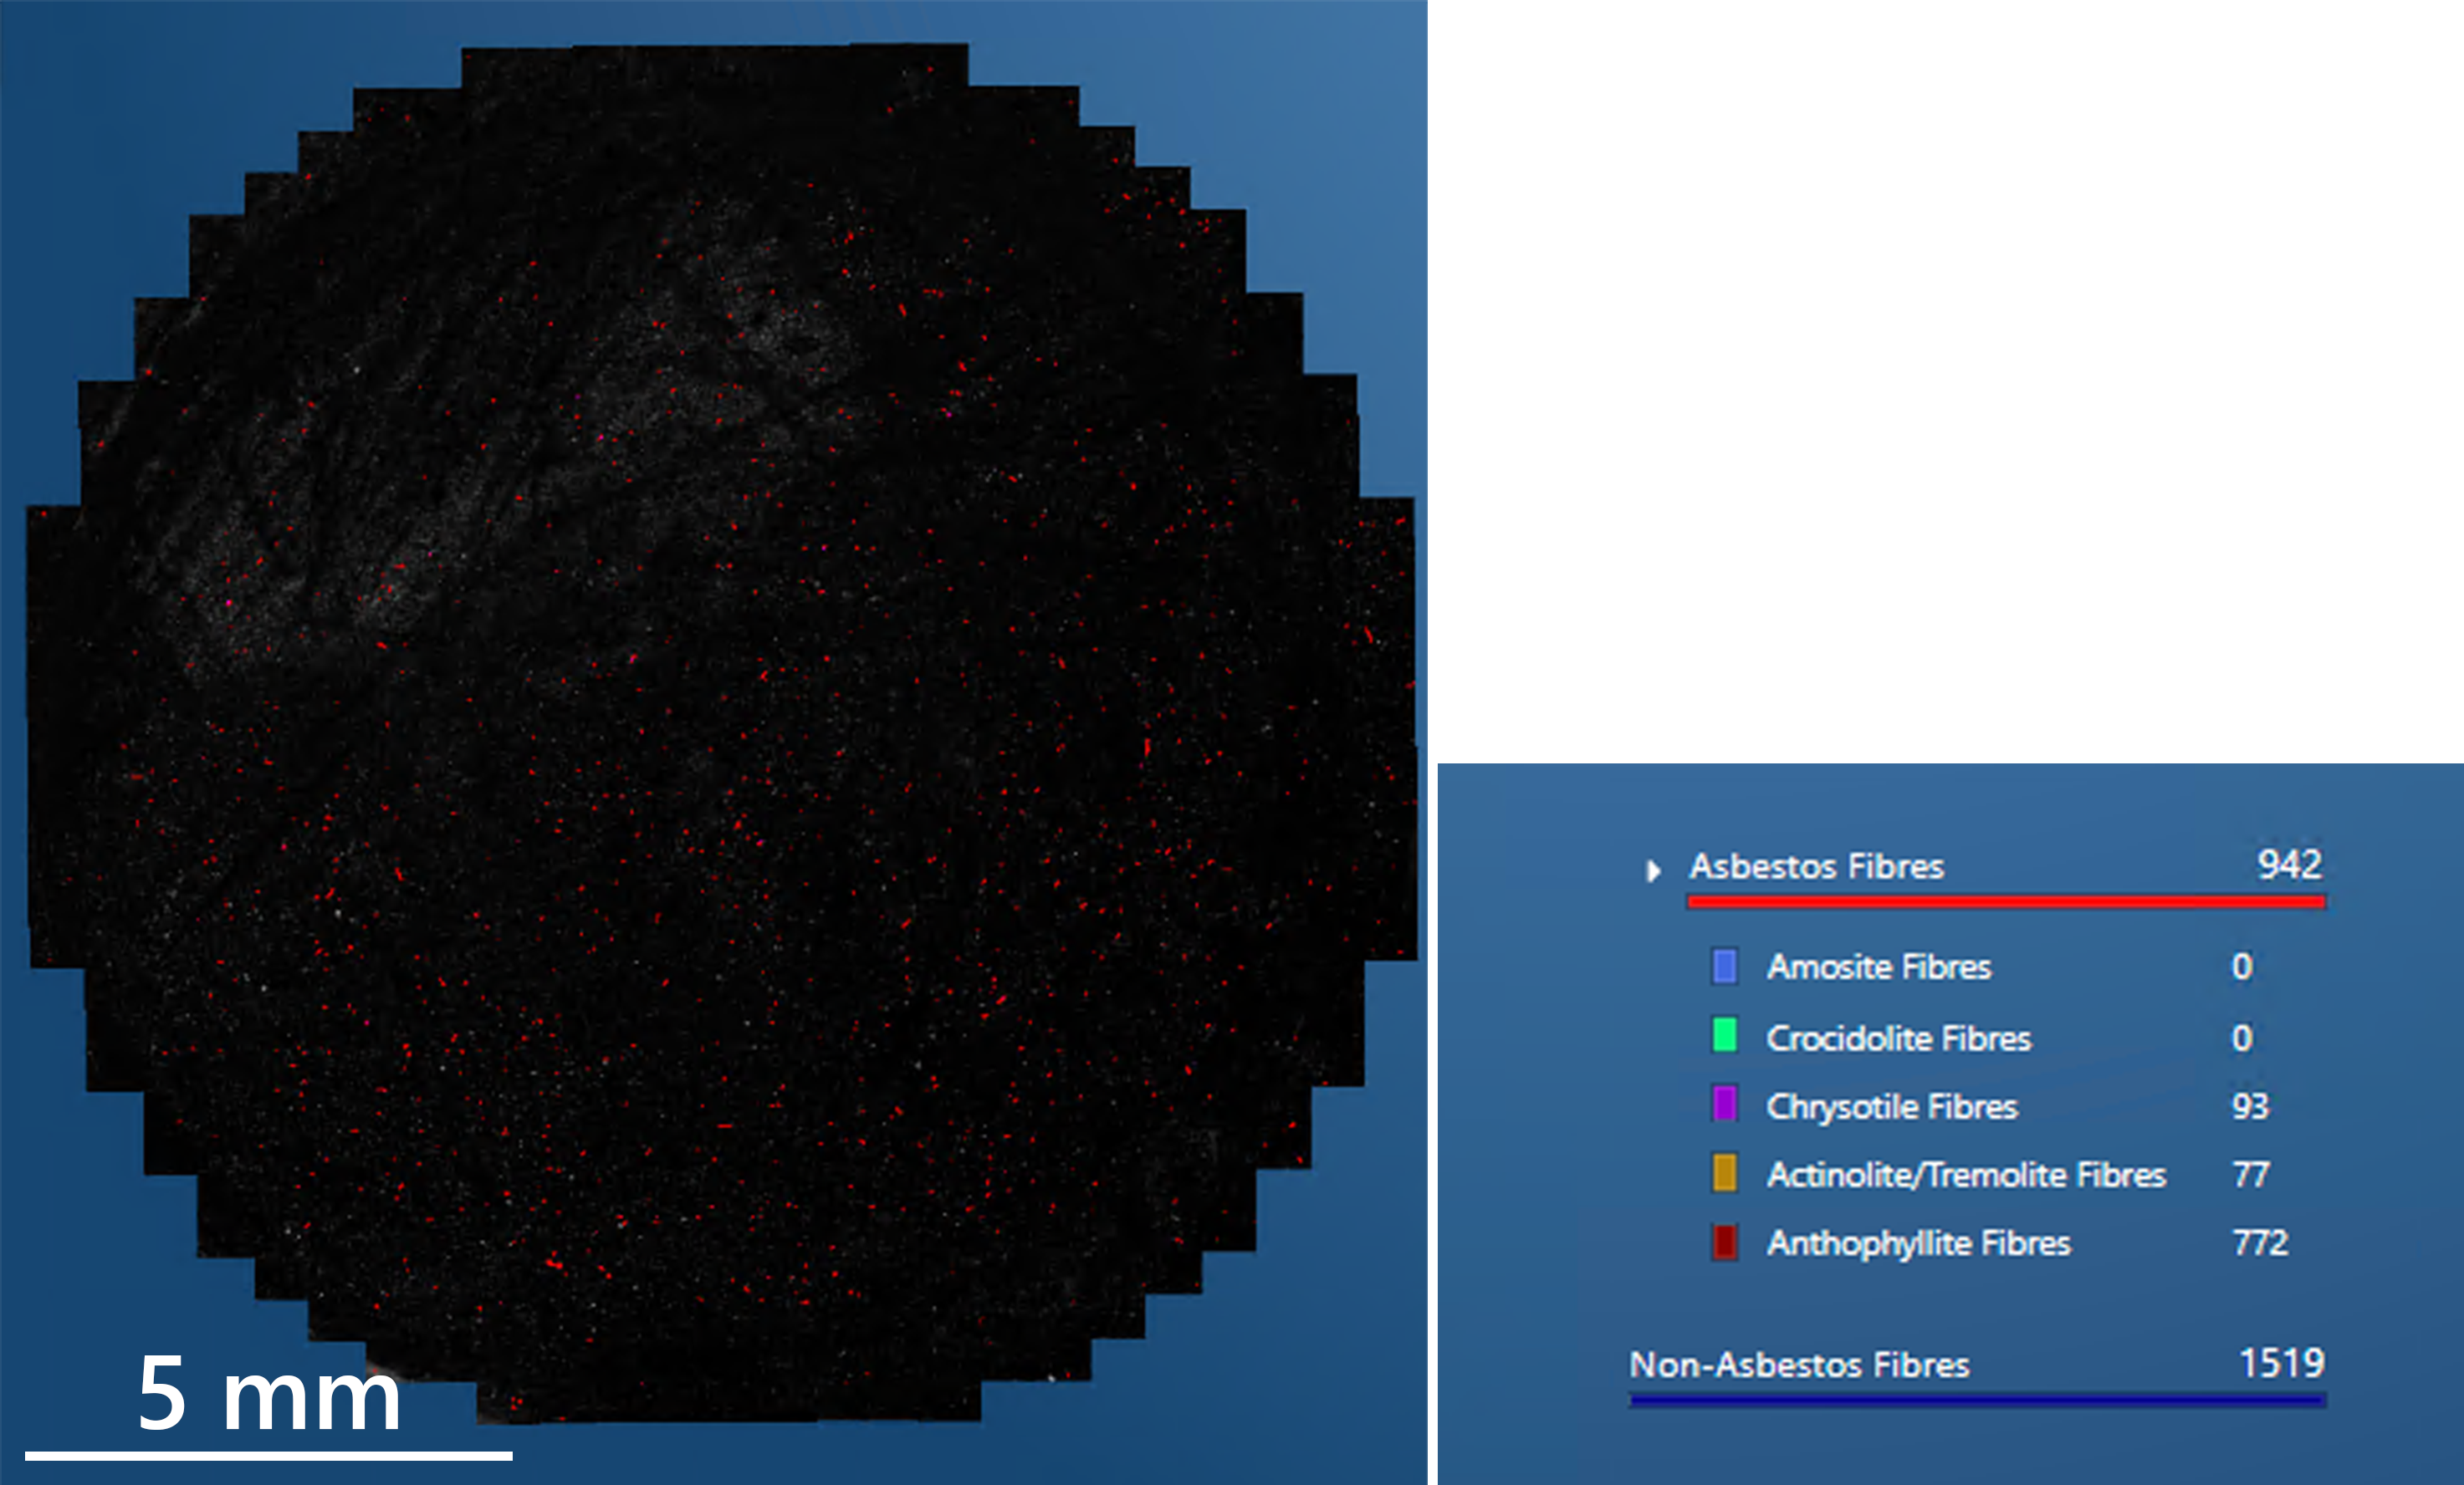 The results shown here were collected with an Ultim Max Infinity 65mm2 detector and are summarised in Figure 7.
Conclusions
This work has shown how an optimised, SEM-based analytical system can provide a robust analytical solution for the investigation of air filter samples that may or may not contain asbestos. The presented solution includes both hardware and software that is designed to simplify the setup process and minimise user derived inconsistencies whilst enhancing ease of use and efficiency.

