Automated mineralogy transformed the evaluation of ore mineralogy and texture by integrating the imaging capabilities of scanning electron microscopy (SEM) with the rapid chemical analysis of energy‑dispersive X‑ray spectroscopy (EDS). The effectiveness of this approach is demonstrated by its long‑standing adoption as the industry standard for orebody characterisation and processing optimisation.
Since its inception, automated mineralogy has relied almost exclusively on ‘floor‑standing’ SEM platforms. Although these systems provide high sample throughput, their use presents significant barriers to entry for many potential users. These barriers include the substantial capital cost of SEM acquisition, the ongoing requirements for maintenance, and the need for a large, environmentally controlled laboratory space. In contrast, tabletop SEMs directly address each of these limitations and have progressively improved in performance, narrowing the gap with traditional ‘floor-standing’ instruments. Notably, the recent availability of high beam currents and large‑area EDS detectors has enabled tabletop systems to achieve acquisition speeds comparable to those of ‘floor‑standing’ SEMs.
This application note demonstrates that high‑quality, high‑speed automated mineralogy can be achieved using the relatively accessible tabletop SEM platform. High speed and reliability are made possible using the latest tabletop SEM–EDS detector; the XploreCompact 65 mm², combined with Oxford Instruments’ Tru‑Q spectrum‑processing technology. Automated acquisition is carried out using AZtecMineral, our dedicated platform for automated mineralogy available on all TTM platforms with AztecLive.
Samples and Methodology
In this study, we examine the mineralogy, texture, and liberation characteristics of a Zn ore sourced from a sedimentary exhalative (SEDEX) deposit. SEDEX systems represent the dominant global source of Zn, Pb, and Ag, forming when metal‑rich brines were expelled onto the seafloor or into shallow marine sediments. These deposits are often challenging to process due to their typically fine grain size and the complex intergrowths of gangue minerals such as pyrite, barite, calcite, and aragonite. Consequently, regular monitoring of grain size and the degree of liberation from these phases is essential for effective beneficiation.
A single sample of crushed Zn ore mill feed was mounted in conductive resin and polished to a flat surface to expose the embedded rock fragments. The mounted sample was coated with a 10 nm layer of carbon, and electrical grounding to the SEM stage was achieved using conductive tape.
Automated mineralogical analysis was carried out using a Hitachi TTM4000III tabletop SEM equipped with a single large‑area EDS detector (XploreCompact, 65 mm²). Automated data acquisition was performed using the AZtecLive software package with the AZtecMineral module enabled. During characterisation, an accelerating voltage of 20 kV and a beam current greater than 10 nA were employed to ensure high output count rates (> 300 kcps), enabling efficient analysis of large areas. Each particle was measured for 0.08 seconds, providing more than 20,000 counts per EDS spectrum to support accurate mineralogical identification. Post‑processing and mineral liberation analysis were conducted using GrainAlyser 2 (GA2).
Results
A total of 44,417 particles were analysed in 1.5 hours across a 2.5 cm2 area.
At each field of view, a BSE image was automatically acquired and segmented using user‑defined greyscale thresholds. Following segmentation, the electron beam was directed to each particle in turn to collect EDS data across its entire surface area. In total, 44,417 particles were analysed across 426 fields arranged in a grid pattern. The quantified EDS results for each particle were then automatically processed through a classification scheme based on elemental weight‑percentage thresholds, enabling assignment of each particle to a mineralogical category (Fig. 1).
| Data Collection Statistics |
- 44,417 particles
- > 300 Kcps output count rate
- 0.08 seconds acquisition time per particle
- Time to complete full stub = 3 hours*
*Extrapolated from completion time of 2.5 cm area *
|
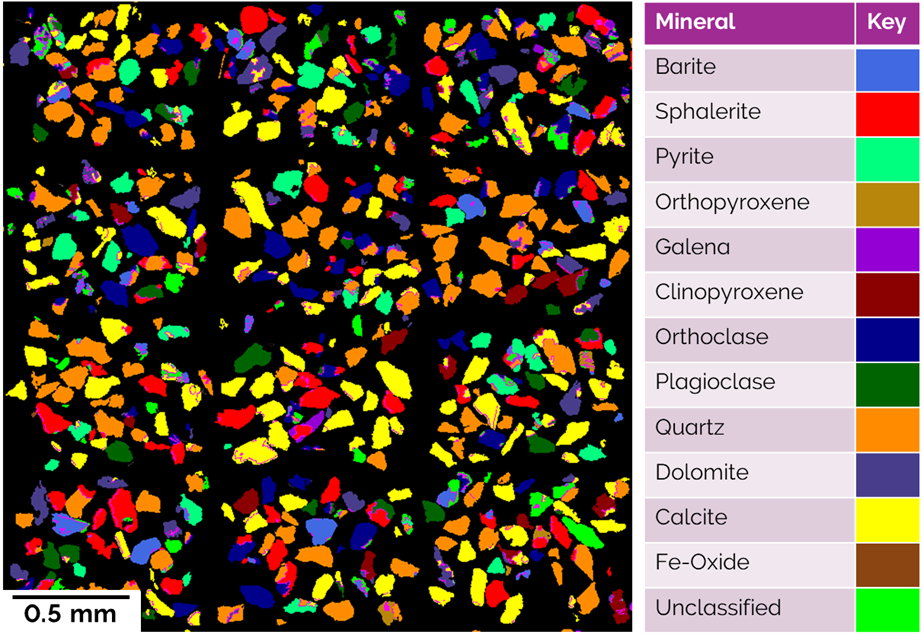
Figure 1- Screenshot of mineral map subsection captured from the ‘review’ stage of AztecMineral.
Bulk Mineralogy and Mineral Association
The sample is dominated by carbonate, silicate, and sulphide gangue minerals—principally calcite, quartz, and plagioclase—which together accounted for 62% of the analysed area (Fig. 2). The main ore mineral was sphalerite (ZnS), comprising 15% of the sample area (Fig. 2), with galena (PbS) present as a minor by‑product phase at approximately 1% (Fig. 2). Sphalerite exhibits a relatively low degree of association with other minerals, with 60% of grains occurring as completely isolated (‘solo’) particles. In contrast, galena showed strong association tendencies, with more than 70% of grains amalgamated with at least one other phase (Fig. 2).
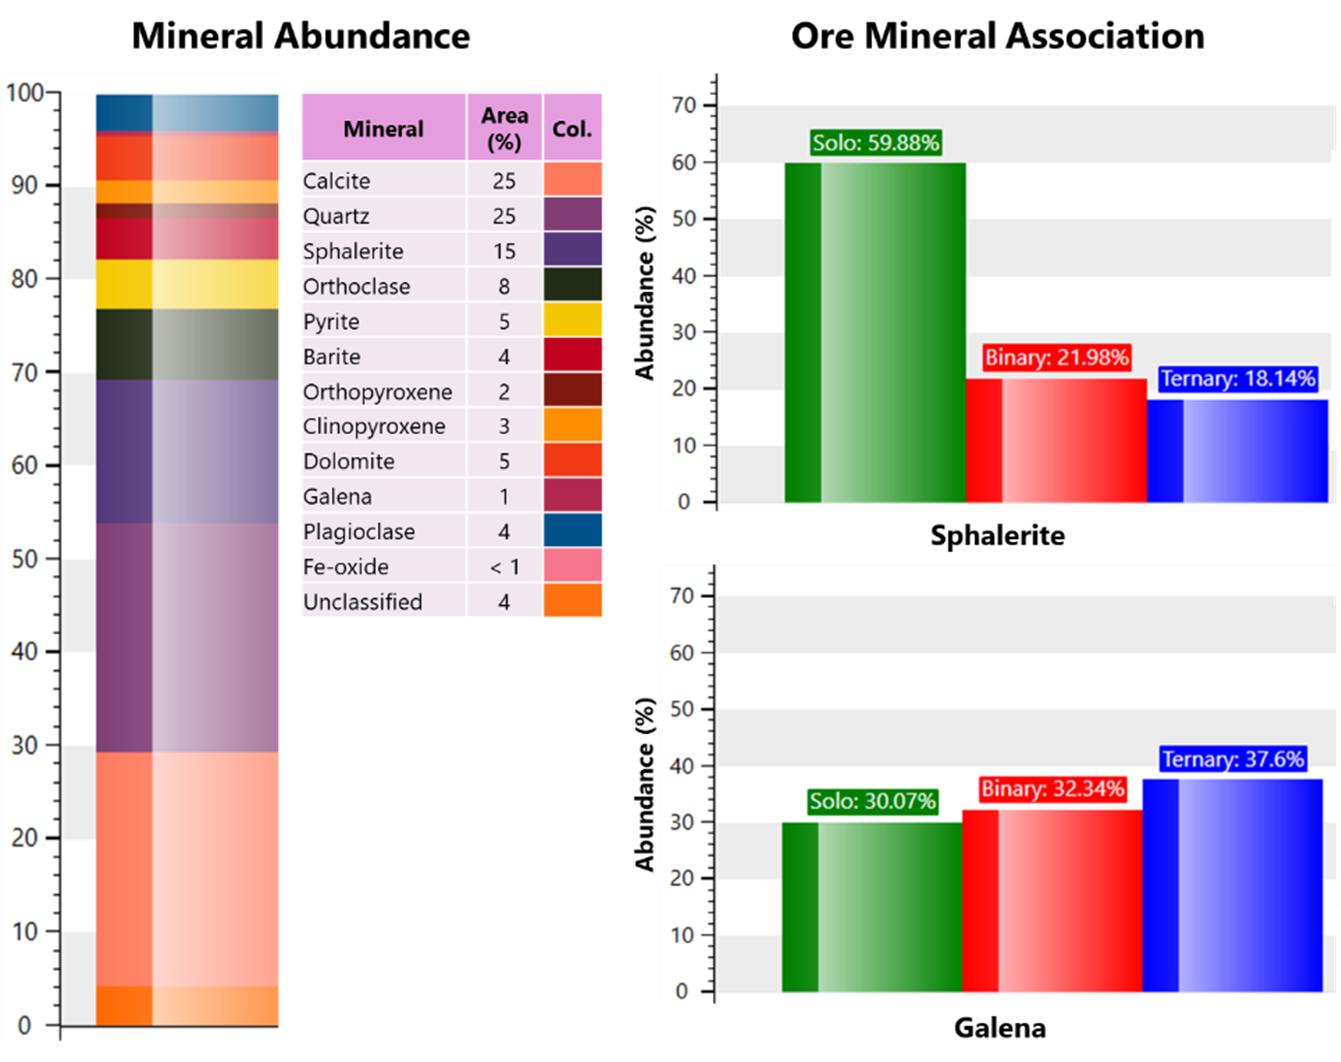
Figure 2- Mineral abundance and mineral association statistics of sphalerite and galena extracted from GA2 MLA software.
Grainsize Statistics
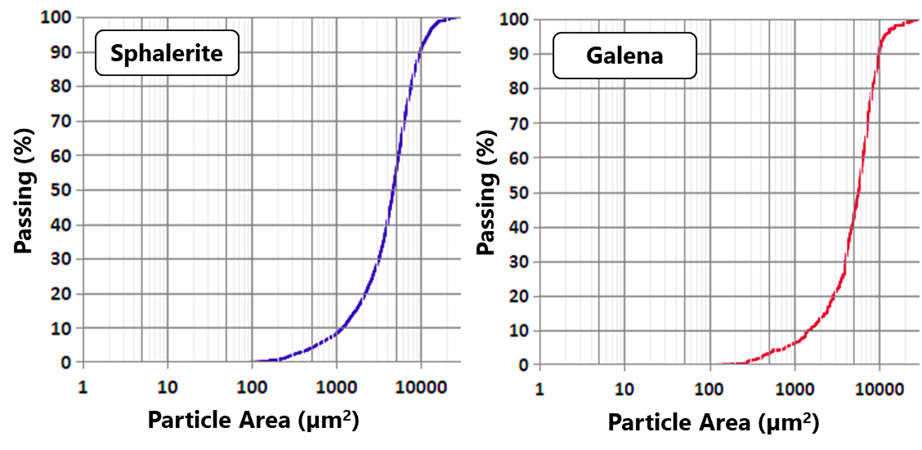 Figure 3- Grainsize distribution graphs for ore minerals sphalerite and galena.
Automated calculation and visualisation of grain‑size distributions were performed for the ore minerals sphalerite and galena. Both minerals exhibited an 80% passing size (‘P80’) of approximately 8000 µm2. The median particle size (50% passing) was slightly coarser for galena at 6000 µm2, compared with 4000 µm2 for sphalerite. The feed contained very few fines, with less than 10% of particles for both phases measuring below 1000 µm2.
Liberation and Grade Recovery
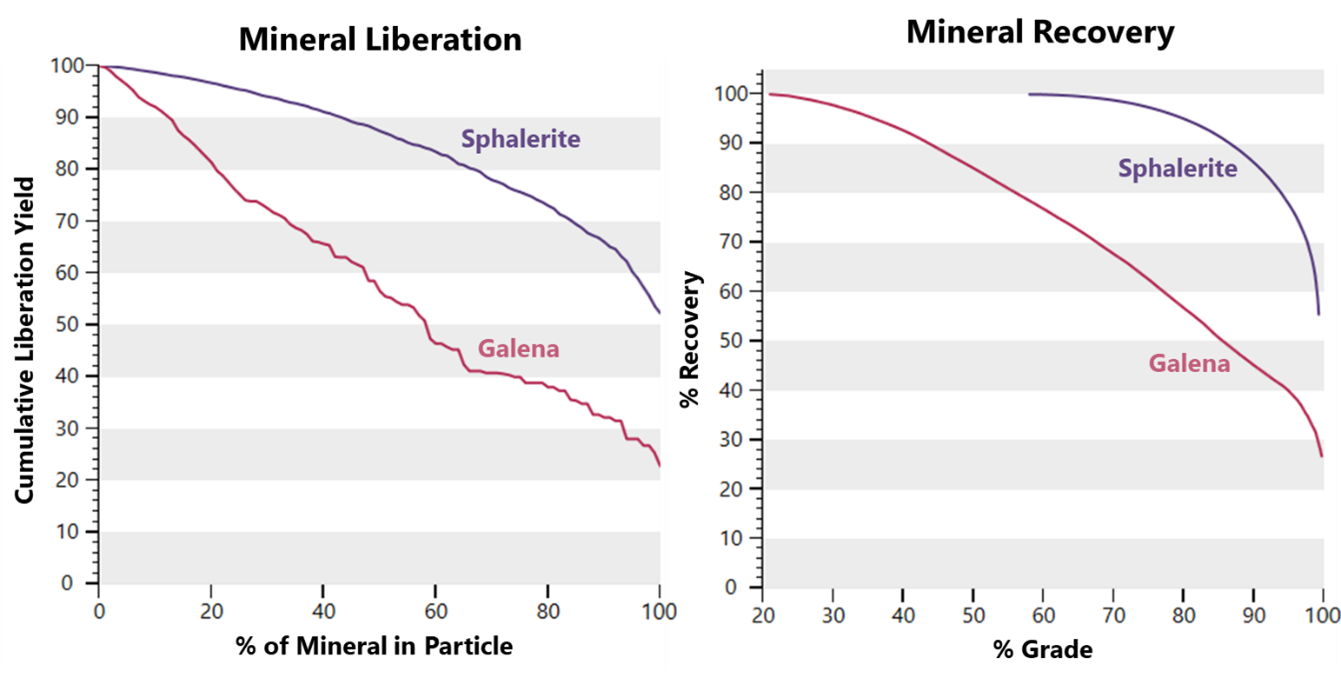 Figure 4- Mineral liberation and recovery graphs extracted from GA2.
Liberation and recovery statistics were automatically calculated and displayed using GA2 (Fig. 4). The mineral liberation plot in Figure 4 showed that more than 50% of the sphalerite was fully liberated. In contrast, galena exhibited substantially lower liberation, with only 22% of grains occurring as fully liberated particles. This difference was consistent with the stronger binary and tertiary associations observed for galena compared with sphalerite in Figure 2.
The curvature of the sphalerite liberation curve further indicated a higher degree of within‑particle purity; for example, approximately 70% of sphalerite occurred in particles containing more than 80% sphalerite by area. By comparison, the galena liberation curve was noticeably flatter, demonstrating that more than half of the total galena yield is present in particles containing less than 50% galena.
As a result, the theoretical maximum recovery at current grind size is much higher for sphalerite as opposed to galena. The recovery for sphalerite remains above 90%, even if the grade is increased to 80%. However, as the galena is stuck in low grade particles, the recovery curve drops quickly. For example, for a grade of 80% galena, recovery falls to 58%.
|
Actionable insight from tabletop SEM automated mineralogy in 1.5 hours:
Sphalerite is abundant and well-liberated. A very high grade (~90%) can be achieved while still maintaining over 80% recovery. If a galena by-product is desirable, then a finer degree of crushing will be required as this phase is significantly locked with other minerals.
|
Conclusion
This study demonstrates that a modern tabletop SEM equipped with the XploreCompact 65 mm² EDS detector can deliver rapid, high‑quality mineral liberation analysis. Here, we successfully analysed 44,417 particles across 462 fields in 1.5 hours, utilising the latest technology for efficient automated mineralogy. The resulting outputs and real-time delivery are consistent with the industrial standard set by ‘floor standing’ systems.
These findings reinforce the premise introduced at the outset. Contemporary tabletop SEM-EDS technology can now provide fast, reliable, and actionable results without the traditional barriers associated with ‘floor standing’ systems.

