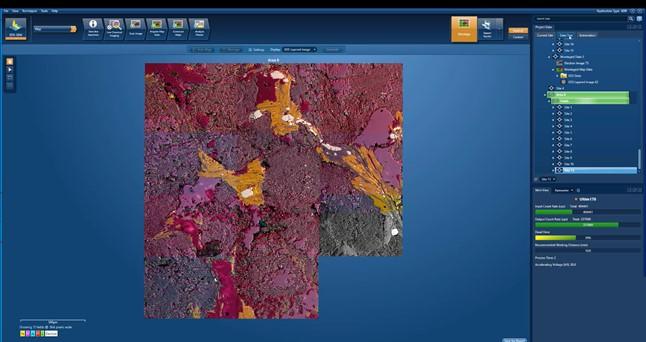
In our previous, blog we were discussing challenges associated with analysis of a large geological sample. We introduced the Large Area Mapping solution in the AZtecLive NanoAnalysis suite and showed its use on a granite sample. We covered a large area by automatically collecting multiple individual electron images and EDS X-ray maps in a grid across the sample, and with the help of this functionality, we were able to quickly gain a good understanding of it. We showed a video in the previous blog in which you could see how the maps were set up: Figure 1 shows the large area map run in progress.
Figure 1: Automated Large Area Mapping run
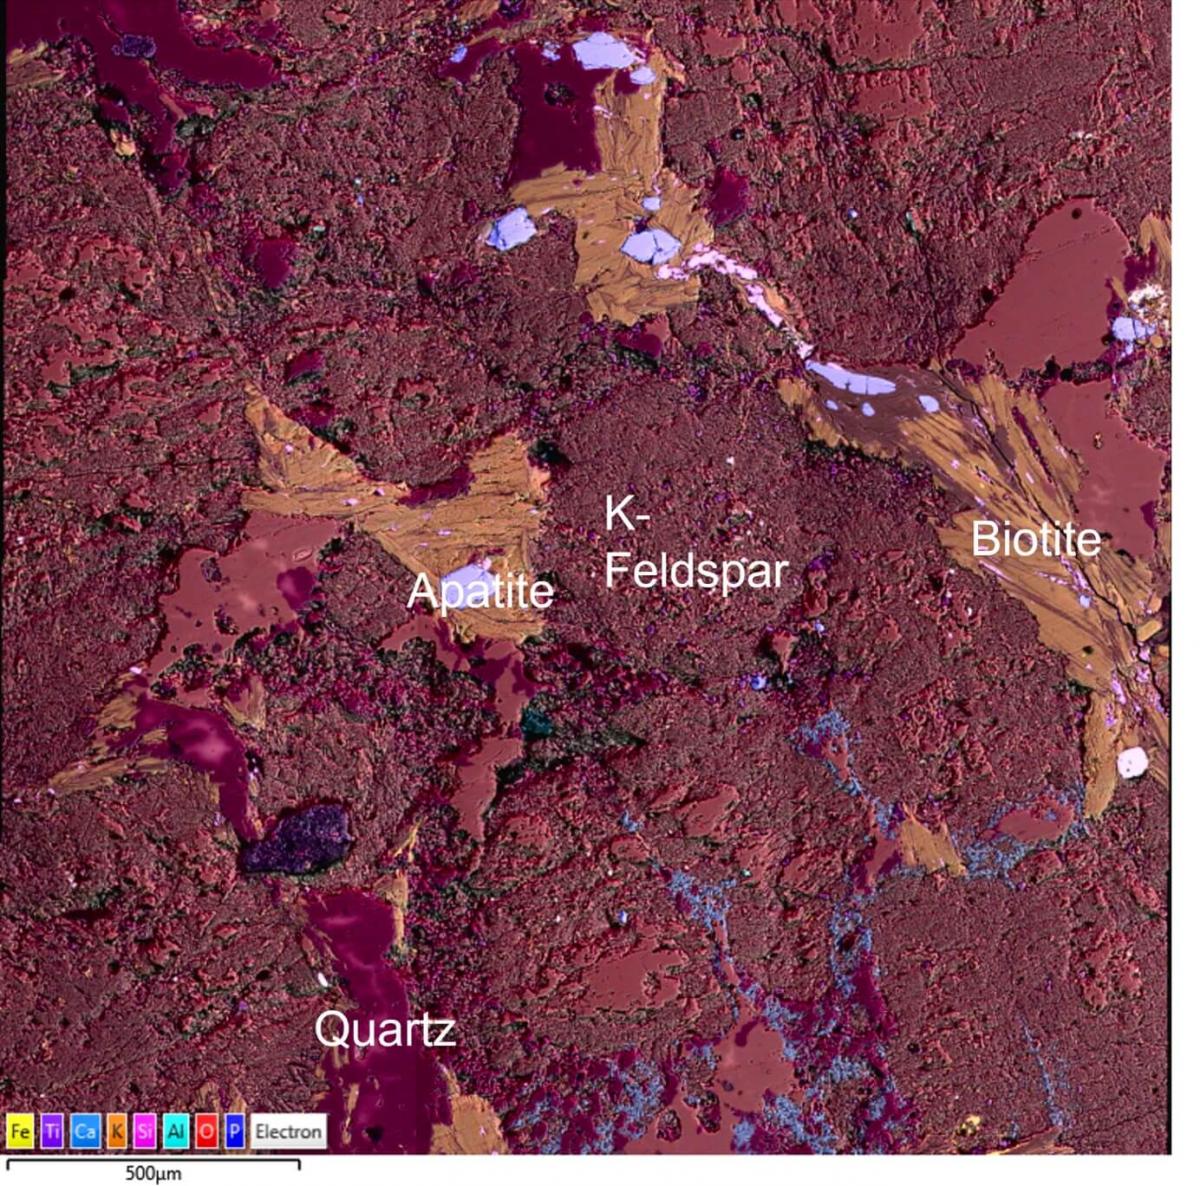
Immediately after the large area mapping run, the electron images and X-rays maps from the defined area were montaged together to create one large image. With the latest generation of silicon drift detectors for EDS analysis, like Ultim Max, tasks like these can be completed in only a few minutes.
In the video, which shows the large area mapping of a granite sample, you can see how elements are automatically identified as soon as mapping starts. It is then easy to identify the different minerals in the sample - for example, the largest pink phase can be identified as K-feldspar (KAlSi3O8). Neither Ca or Na were identified, so we can conclude that Plagioclase feldspars (solid solution between CaAl2Si2O8
and NaAlSi3O8) are not present in any significant quantity.
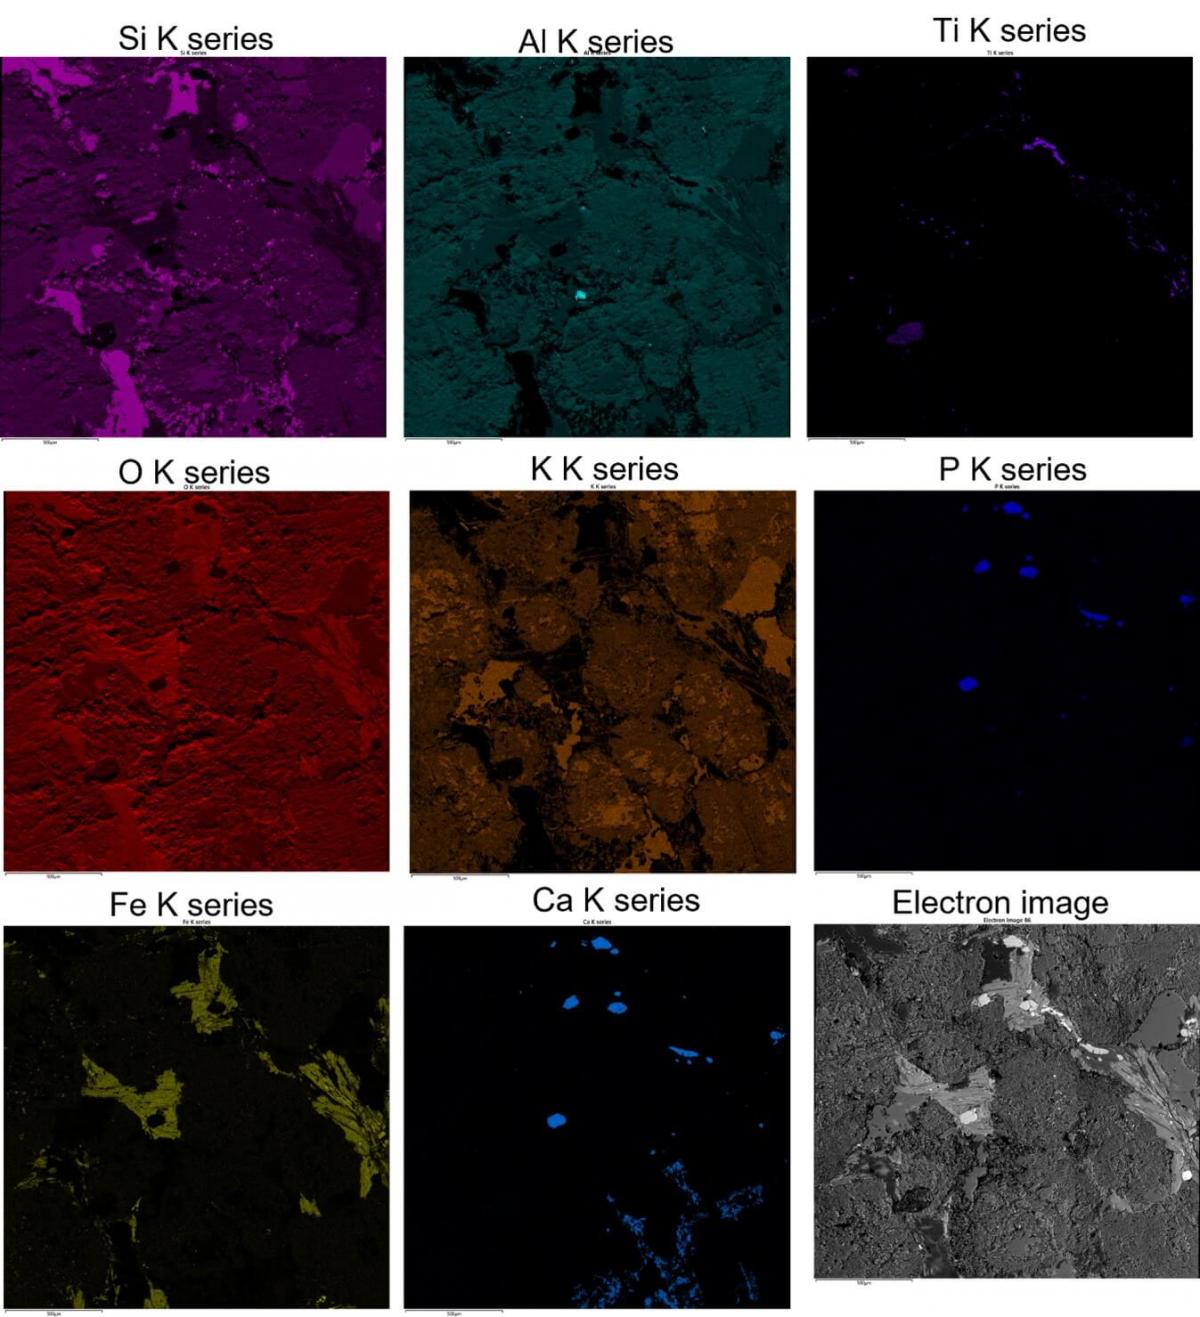
If we examine both the Si and Al X-ray maps, we can see that higher intensity regions in the Si map appear darker in the corresponding areas on the Al map. The absence of Al indicates these dark pink regions are Quartz. Some quartz grains are rounded and others more irregular.
In addition, we can identify Apatite – CaPO4 – this is particularly clear from the Ca and P maps.
One thing you may have noticed in the video – in the optical image of the sample at the beginning – is that the sample contains a large number of black grains that are visible to the naked eye. These grains are distinguishable by their prominent foliated texture and only show cleavage along one direction. The grains can also clearly be seen in the large area map; in figure 2 they appear as an off-yellow colour grains and are shown to be rich in Fe, Mg and Al and are therefore believed to be biotite - K(Mg,Fe)3(AlSi3O10)(F,OH)2.
Figure 2: Montaged large area layered map and selected individual-X ray maps
I hope that this blog has shown you how, with AZtec® Large Area Mapping, extensive compositional information can be collected in one automated run on a large sample area. We were able to maintain the high resolution of each individual field and collect enough data to continue with more in-depth analysis offline. If you are interested in finding out more about mapping of this sample, please check out our application note on the topic which will be coming out soon. To learn more about our AZtec Large Area Mapping click here.