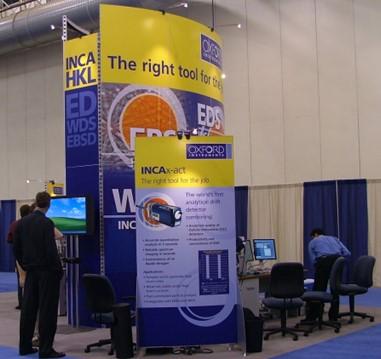
Take a look at the photograph below. It shows the setup of the Oxford Instruments stand for the M&M conference in Chicago in 2006. You will see ‘ED’ on the side panel and ‘EDS’ on the front panel. Perhaps ED was a (failed) attempt to find a unifying common name for our analytical technique? So, what do the names commonly used in our field actually mean?

Energy Dispersive X-ray Spectrometry (EDXS) is the routine technique for determining the elemental makeup and composition of materials in the Scanning or Transmission Electron Microscope (SEM/TEM). EDXS is almost always shortened, and EDS is used instead.
Energy Dispersive X-ray (EDX) Analysis is the same method for compositional analysis using an electron microscope. The terms EDXA and sometimes even EDAX are also used for referring to the method in this way.
Therefore, the terms EDS and EDX are both used (often interchangeably) to talk about the same method or the same equipment. In the view of some, they actually mean something subtly different: EDX refers to the method, EDX analysis; while EDS is the equipment, Energy Dispersive Spectrometer.
Before we finish on names, it is worth mentioning that the technique is almost always referred to as Energy Dispersive X-ray Spectroscopy rather than Spectrometry. In this blog, I am not intending to comment on which terms are more correct. However, I would say that, in my experience, using “Spectroscopy” in searches for information about this technique is usually more fruitful, due to its much higher usage.
So that took me four paragraphs to say something that I could have said in a few words … EDS and EDX … they are (pretty much) the same.
What is EDS/EDX: an alternative answer
While researching this blog, a web search brought up the question, ‘Can anyone explain to me the difference between X-ray mapping and EDS in the SEM?’ This made me think about what EDS/EDX is to an analyst or SEM user today, and the four stages of EDS capability development I have experienced over the past 25 years.
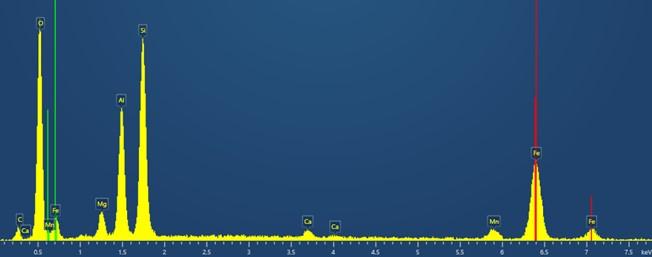
Stage 1. Spectrum collection and analysis
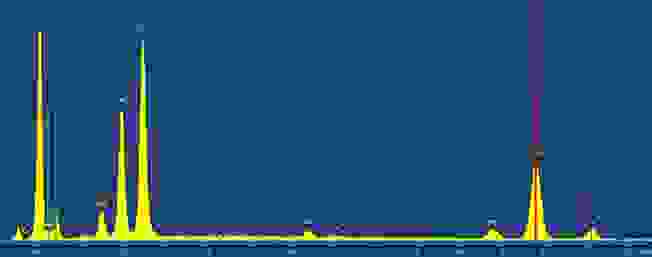
The first EDS system I used collected a spectrum from the area of the sample being imaged by the microscope. The peaks in the spectrum were identified manually using markers showing the position of different X-ray lines. In this way, by visiting different phases in a sample, the elements they contained and what the phases most likely were could be determined.
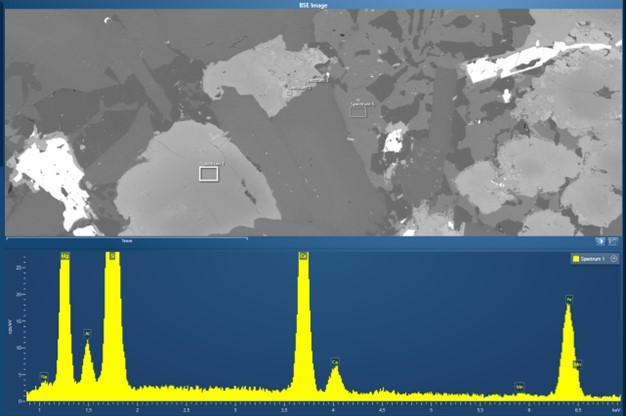
Stage 2. Point and ID and X-ray Mapping
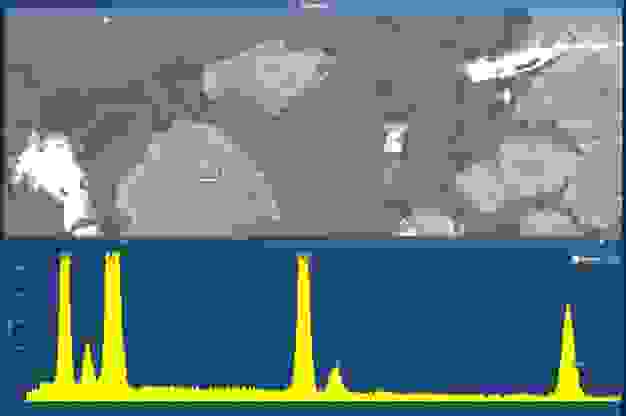
With digital beam control came systems where EDS scan generators could control the SEM scanning system. This enabled the chemistry of each phase/feature to be investigated by clicking on a point/area of an electron image. This allowed the sample structure/morphology to be easily linked with its composition: so-called ‘Point and Shoot’ or ‘Point and ID’. This increased speed and interactivity of analysis required the development of AutoID for rapid elemental identification of the peaks in the spectrum.
Control of a microscope scan also enabled an EDS system to collect EDS information while scanning the beam over the sample and construct images of intensity difference over the scanned region, ie X-ray maps. Therefore, interesting or complex areas could be investigated in more detail using X-ray mapping to show a more complete picture of element variation.
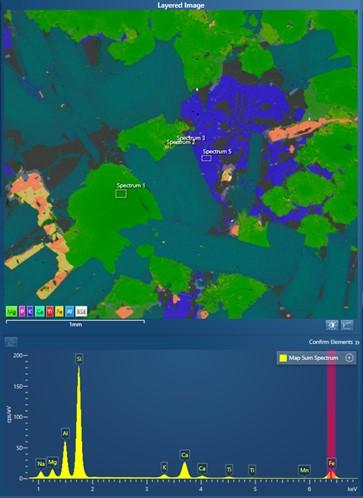
Stage 3. Mapping Centric Analysis
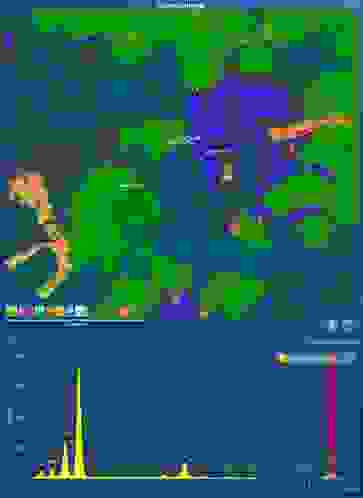
With the introduction of large area SDD detectors, high-quality EDS data could be collected at a speed fast enough to allow X-ray maps to be collected in seconds or a few minutes under microscope conditions suitable for many kinds of sample. A layered image, constructed automatically using AZtec AutoLayer, combines the morphology and distribution of major elements in a single, easily interpreted image. This may be sufficient for analysis. Otherwise, it might act as a much better guide for identifying the areas of interest for the collection of spectra than a grey level electron image. Alternatively, because all the X-ray information collected at each pixel in the map is stored (so-called smart/spectral mapping or Hyperspectral imaging), a virtual sample is created from which further analysis can be carried out away from the microscope (e.g. spectrum reconstruction from a point on a stored map).
Stage 4. Live Chemical Imaging
Live chemical imaging (LCI) finally brings SEM imaging and EDS elemental analysis together into one seamless and integrated experience. Gone is the sequential collection of images and EDS data; gone is the switching between microscope and EDS system. With LCI, the imaging and EDS data collection is always on. Both guide the analysis equally at all stages, from initial sample investigation, where you are moving round the sample identifying areas of interest, through to detailed analysis of those critical areas of a sample. LCI relies on fast, accurate processing of large amounts of data so that images containing morphology and elemental information are produced in fractions of a second, and the most complex X-ray spectrum is turned into an accurate compositional analysis in real time.
So, what does EDS or EDX analysis mean to you?
As I have progressed from Stage 1 to 4, I have experienced ever more rapid, accurate and useful information about the samples I am analysing. This has given me ever more productive analysis and certainty that I can get to the point where I really understand the critical issues I need to from my sample analysis.
Which stage of EDS / EDX do you use?
If you want to learn more about how EDS/EDX works, click here.